Most yoga and wellness studios sit on a goldmine of class data — and never read it. Studios running 50–500 classes a month know roughly which times fill up and which instructors are popular, but very few can answer two harder questions on demand: which class types actually clear costs after rent and instructor pay, and which instructors are quietly losing attendees to cancellations. The Yoga & Wellness Studio Dashboard in Excel solves both in a standard Excel file.
This 5-page, slicer-driven dashboard tracks 5 headline KPIs and 18 chart-level metrics across Overview, Class Performance, Instructor Analysis, Member Insights, and Studio Trend pages. It is built on standard Excel pivot tables — no Power BI, no add-ins, no macros. Setup runs under 10 minutes for studios that already export class logs from Mindbody, Glofox, Vagaro, or Acuity.
Click here to Purchase the Yoga & Wellness Studio Dashboard in Excel
What Is the Yoga & Wellness Studio Dashboard in Excel?
The Yoga & Wellness Studio Dashboard in Excel is a self-contained Excel file that converts your raw class log into a multi-page interactive dashboard. Every chart, KPI card, and pivot updates automatically when you click Data → Refresh All. Slicers along each page let you filter by Class Type, Studio Location, Instructor, Class Level, Member Type, and Booking Channel without writing a single formula.
The dashboard works for single-studio operators, multi-location wellness brands, and hybrid yoga + meditation businesses. It does not handle live bookings — but if you already use a booking platform, exporting class logs into this file gives you analytics that go deeper than the booking tools’ built-in reports.
Key Features of the Yoga & Wellness Studio Dashboard in Excel
📊 5 KPI cards on the Overview page. Total Revenue, Net Profit, Total Classes, Total Attendees, and Avg. Satisfaction sit at the top of the dashboard. Every card responds instantly to slicer clicks, so a studio owner can read overall health in under 30 seconds.
📈 18 charts across 5 themed pages. Each page isolates a different decision: Overview answers “how is the studio doing”, Class Performance answers “what should I schedule next quarter”, Instructor Analysis answers “who deserves a raise and who needs coaching”, Member Insights answers “which marketing channel and plan tier actually works”, and Studio Trend answers “should I expand or consolidate”.
💸 Profit Margin % by Class Type and by Studio Location. The metric most yoga studios never measure. Headcount and margin are not the same thing — a packed Sunday vinyasa class can lose money if the instructor’s pay rate eats the revenue.
🧘 Cancellation Rate % by Instructor. Most booking platforms report cancellations as a single number. Slicing by instructor reveals which teachers quietly lose 15–25% of bookings every week — invisible until churn shows up in revenue.
🔄 One-click refresh. Update the Data Sheet, click Data → Refresh All, and every pivot, chart, and KPI rebuilds in seconds. The hidden Support Sheet handles the pivot mechanics.
Dashboard Pages Explanation
1. Overview Page
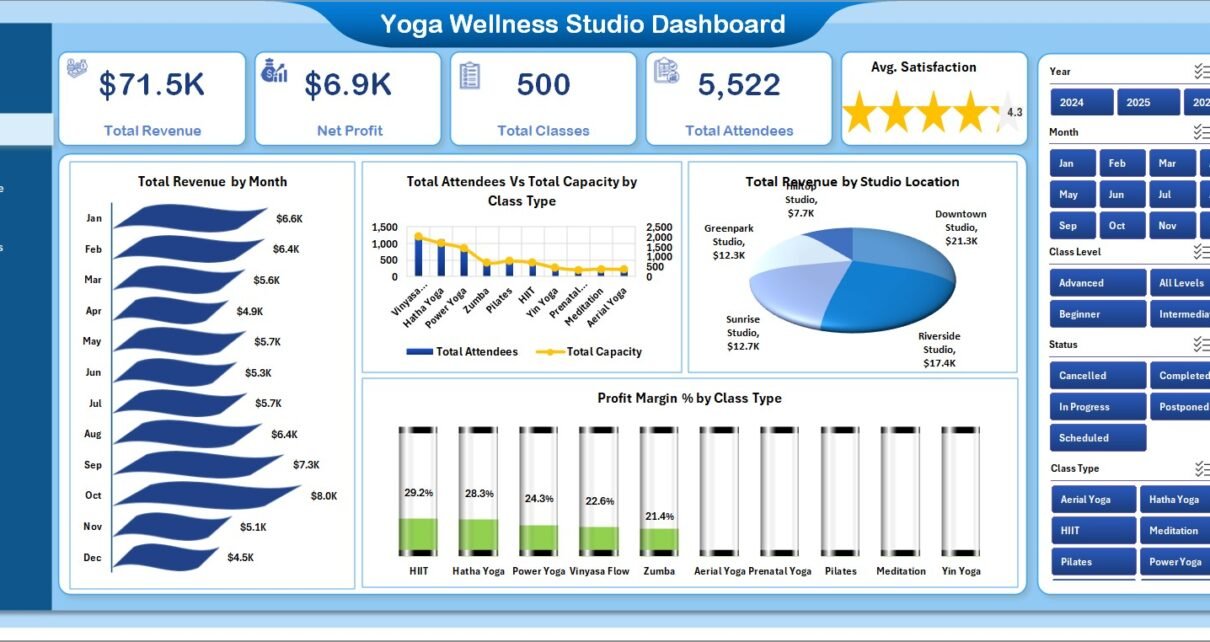
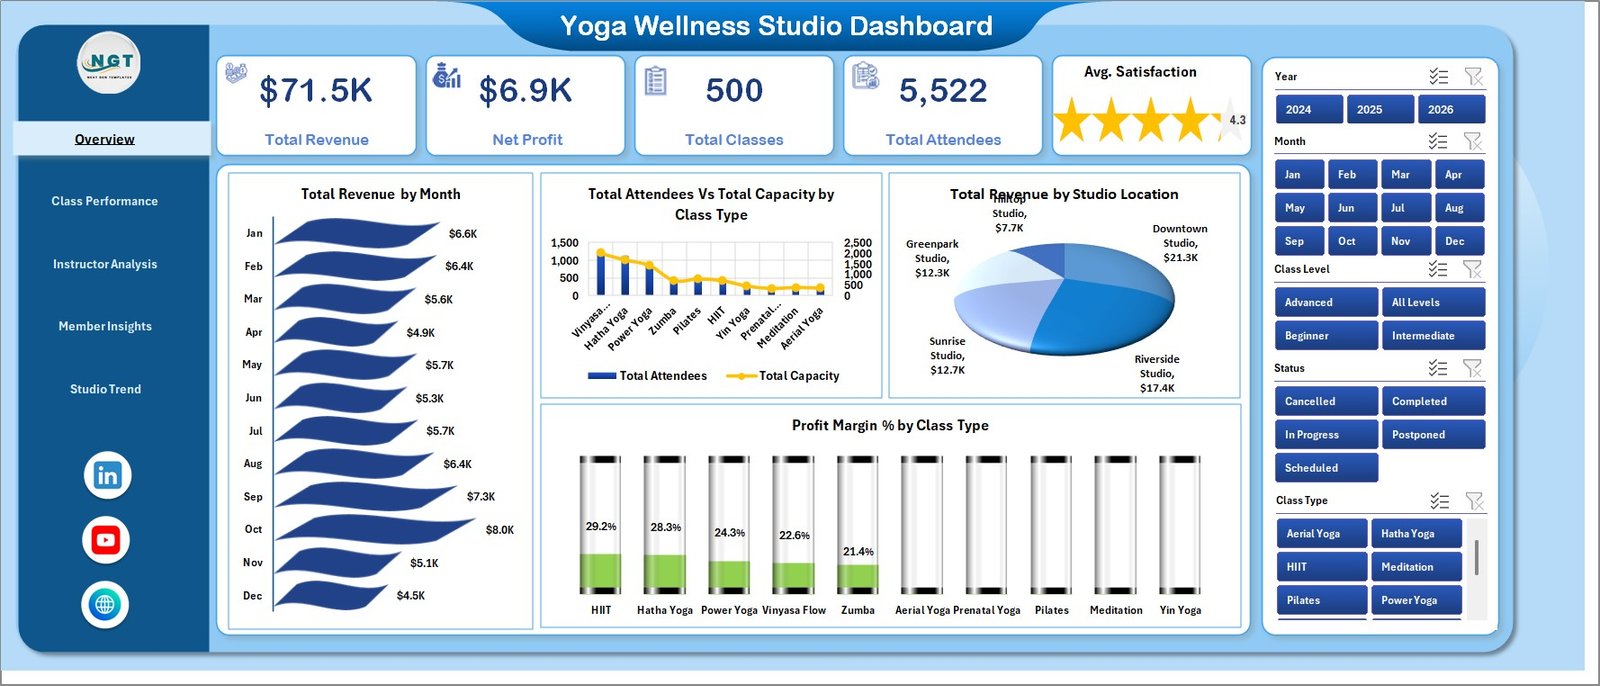
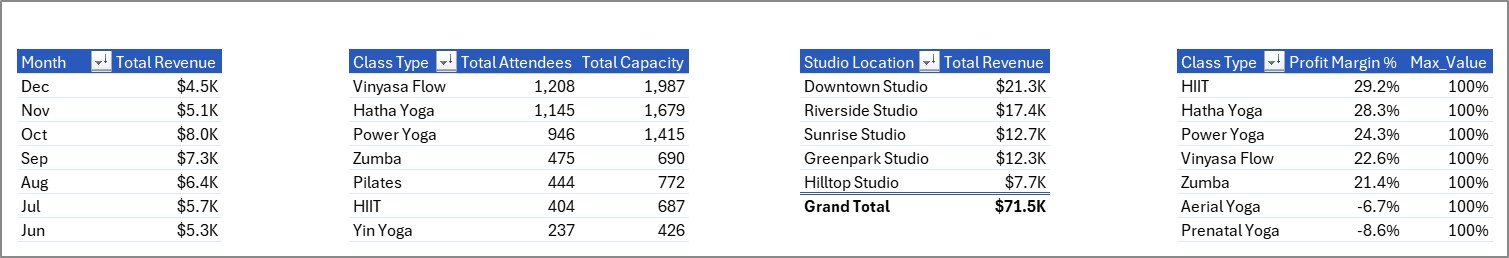
The Overview page surfaces 5 KPI cards on top — Total Revenue, Net Profit, Total Classes, Total Attendees, and Avg. Satisfaction — followed by 4 charts:
- Total Revenue by Month — A monthly trend line showing revenue growth or seasonality.
- Total Attendees Vs Total Capacity by Class Type — Reveals which class types are filling up and which run with empty mats.
- Total Revenue by Studio Location — A simple ranking of which studio location pulls the most revenue.
- Profit Margin % by Class Type — Ranks every class type by margin, not headcount.
Slicers along the side let you filter every visual on the page by Class Type, Studio Location, Instructor, and Member Type at the same time.
Yoga & Wellness Studio Dashboard in Excel – Overview Page
2. Class Performance Page
This is the page to open before you redesign your weekly schedule. It includes:
- Studio Utilization % by Class Type — Capacity-fill rate per class type.
- Total Attendees Vs Total Classes by Class Level — Compares beginner, intermediate, and advanced demand.
- Total Revenue by Instructor — Revenue contribution per instructor.
- Avg. Revenue Per Class by Class Type — The number that drives pricing decisions.
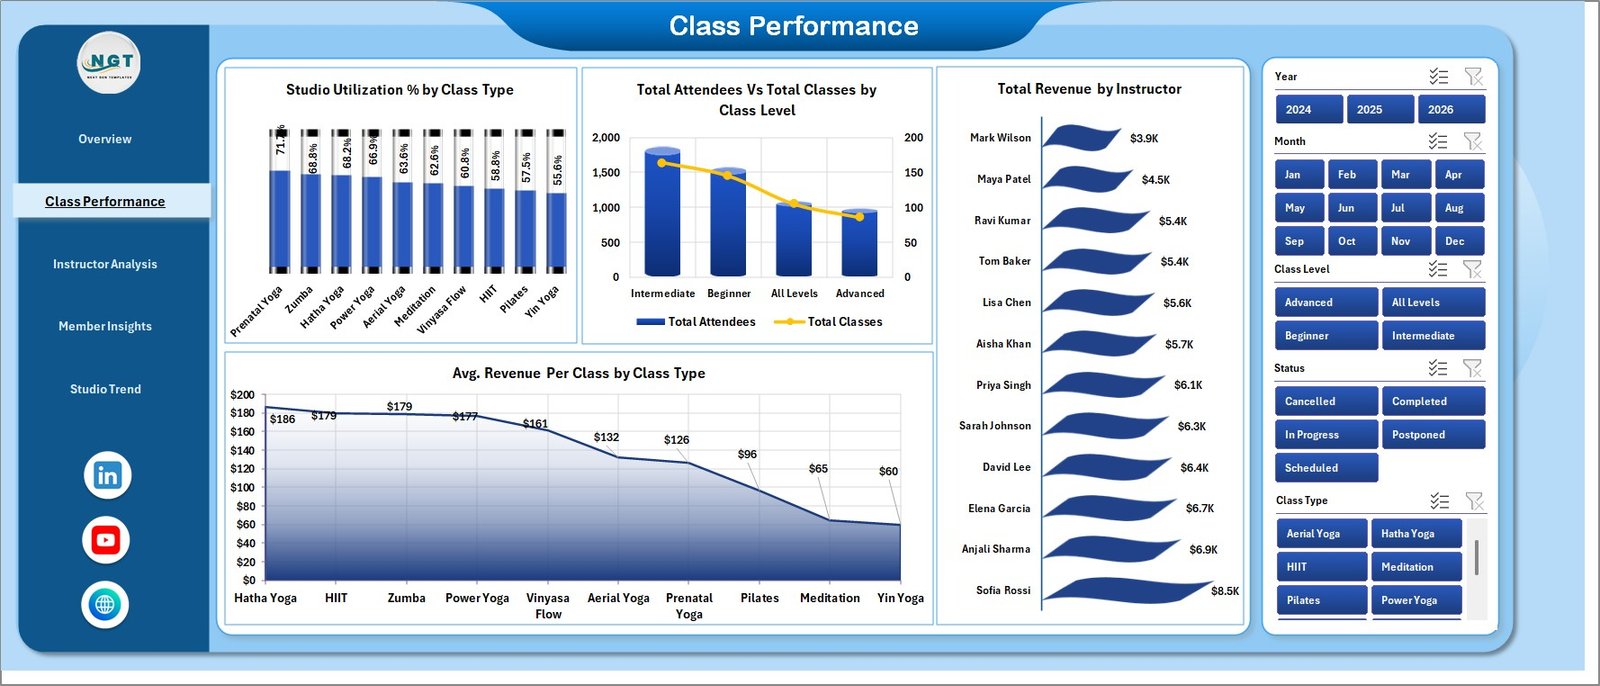
Class Performance
3. Instructor Analysis Page
Use this page for quarterly instructor reviews and pay-rate decisions. It shows:
- Avg. Satisfaction by Instructor — Student-rated satisfaction ranked across the team.
- Total Classes by Instructor — Workload distribution and over-reliance flags.
- Total Revenue by Member Type — Which member types each instructor pulls in.
- Cancellation Rate % by Instructor — The metric that catches quiet attendance leaks.
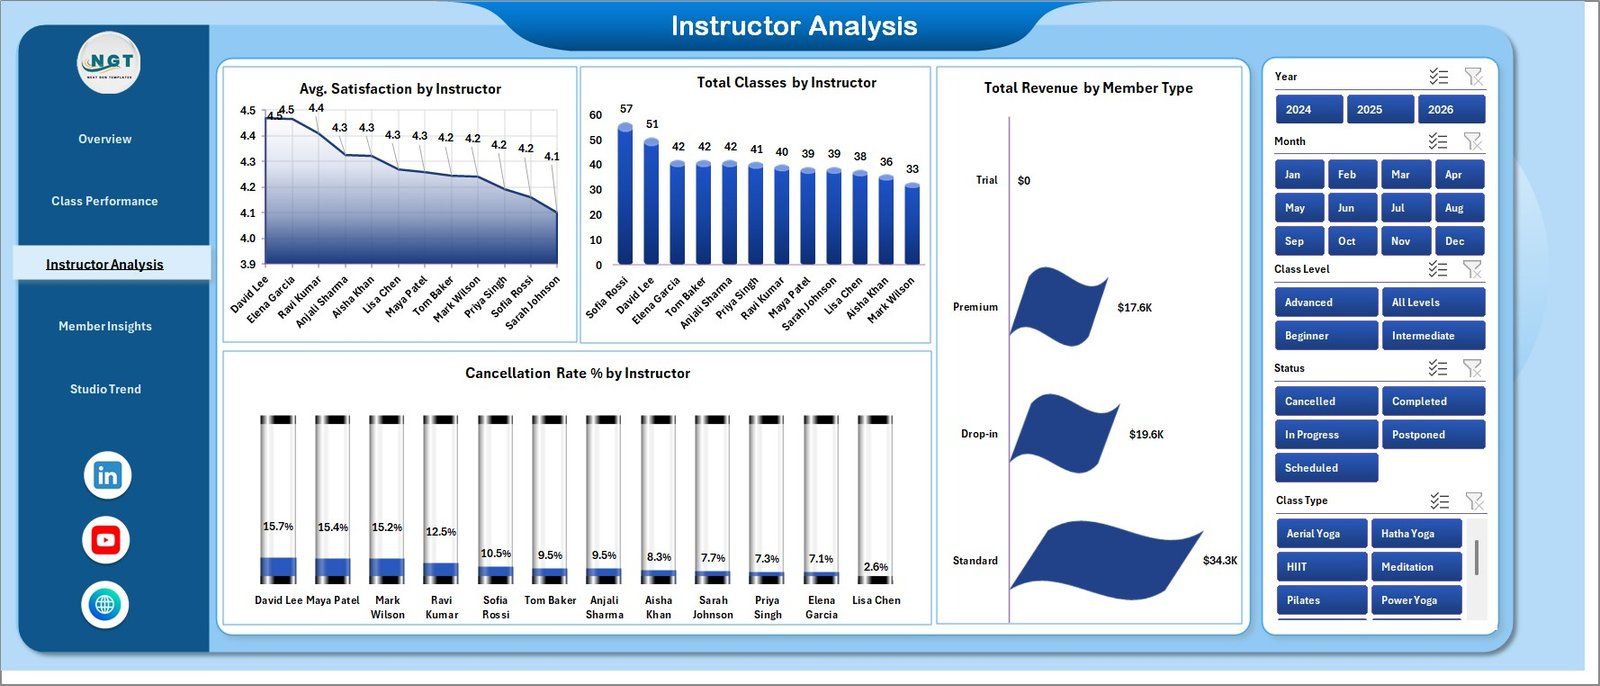
Instructor Analysis
4. Member Insights Page
Built for marketing and pricing decisions. Charts include:
- Total Revenue Vs Total Attendees by Membership Plan — The revenue-vs-volume tradeoff per plan tier.
- Total Classes by Booking Channel — Web, app, walk-in, referral attribution.
- Profit Margin % by Studio Location — Which locations actually print money.
- Avg. Revenue Per Class by Member Type — Drop-in vs. unlimited vs. class-pack revenue.
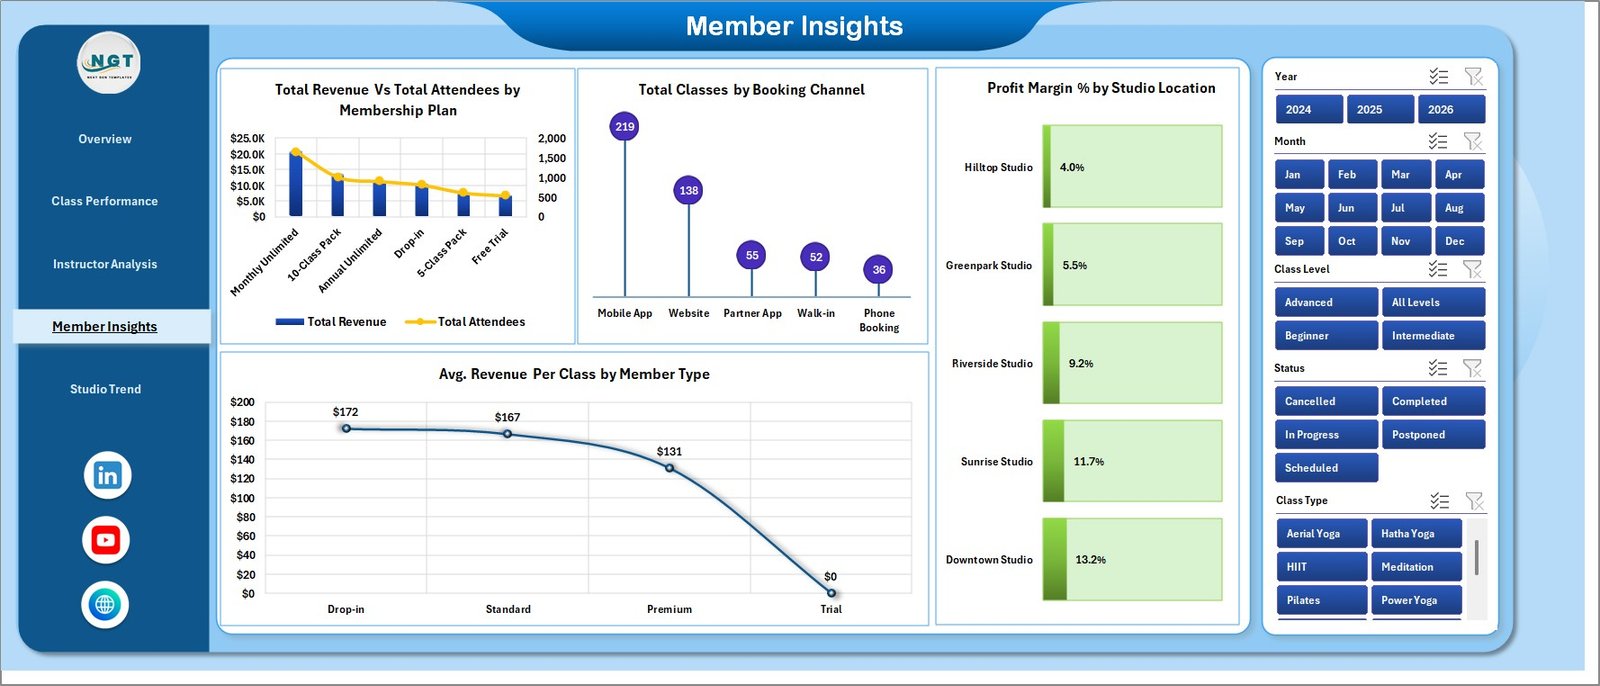
Member Insights
5. Studio Trend Page
The long-horizon view for franchise owners and multi-location operators. Charts include Studio Utilization % by Studio Location, Total Revenue by Year, and Total Attendees by Month. Use this page before signing lease extensions or planning new openings.
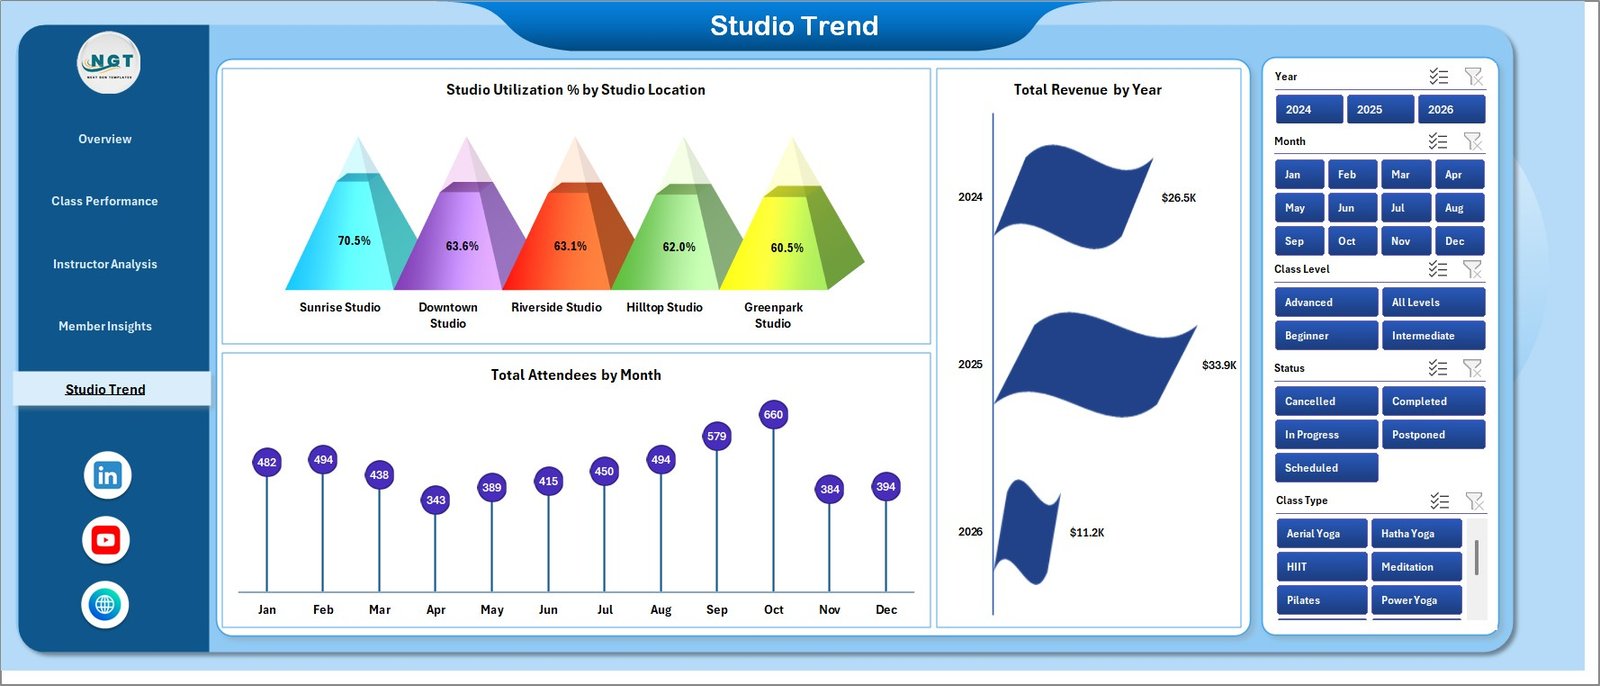
Studio Trend
6. Data Sheet
The single source of truth. Drop your class log here in the same column format. Every dashboard page rebuilds from this one sheet.
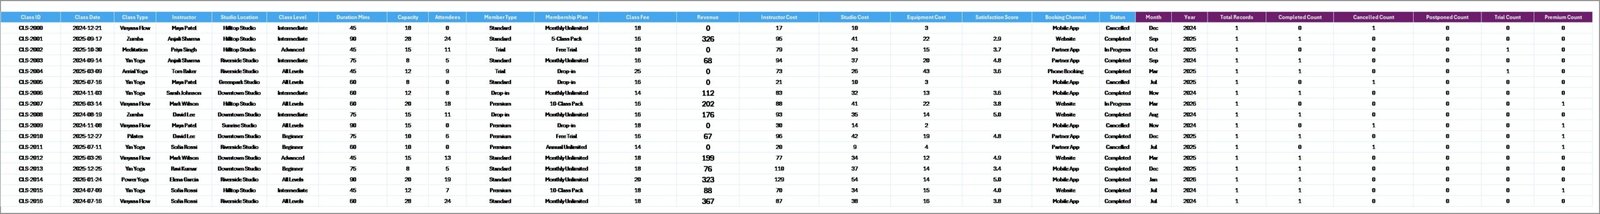
Data Sheet tab
7. Support Sheet
Hidden by default. Houses every pivot table that powers the dashboard. After you update the Data Sheet, click Data → Refresh All on the Excel ribbon, and every pivot, chart, and KPI rebuilds automatically. You can keep this sheet hidden during normal use — right-click → Unhide if you ever need to inspect the pivots directly. (For a full reference on pivot tables, see the Microsoft Excel pivot table documentation.)
Support Sheet tab
Yoga & Wellness Studio Dashboard in Excel vs. Power BI Dashboard vs. Mindbody / Glofox / Vagaro — Feature Comparison
| Feature | Yoga & Wellness Studio Dashboard in Excel | Power BI Dashboard | Mindbody / Glofox / Vagaro |
|---|---|---|---|
| Cost | $17.99 one-time ✅ | $10–$15 / user / month | $129–$349 / month |
| Platform | Microsoft Excel | Power BI Desktop + service | Cloud SaaS |
| Setup time | Under 10 minutes ✅ | 2–4 hours | 1–2 weeks onboarding |
| Profit Margin % by Class Type | ✅ Built in | Custom DAX required | Premium tier only |
| Cancellation Rate % by Instructor | ✅ Built in | Custom DAX required | Premium tier only |
| Mobile access | Excel mobile app | Power BI mobile | Native iOS / Android |
| Customizable charts & KPIs | ✅ Fully editable | ✅ Fully editable | ❌ Locked templates |
| Year-1 cost at 5 users | $17.99 (one-time) ✅ | ~$600–$900 | $1,548–$4,188 |
| Owns the data | ✅ Local file | Cloud-tied | Vendor-locked |
For yoga and wellness studio owners who want Mindbody-grade visibility without paying $1,500+ a year, the Yoga & Wellness Studio Dashboard in Excel sits in the sweet spot.
Who Should Use This Template
Perfect for:
- Independent yoga, pilates, and wellness studio owners (1–5 locations) wanting Excel-based analytics without SaaS fees
- Studio managers running 50–500 classes/month who already export class logs from Mindbody, Glofox, or Acuity
- Wellness brand operators comparing performance across multiple studio locations and class types
- Boutique fitness operators (barre, meditation, breathwork) where margin-by-class-type beats headcount as a metric
Not a fit if:
- You need live booking, automated billing, or member self-service portals — use a booking SaaS for that
- Your team won’t keep a clean weekly class log — garbage in, garbage out applies
- You need real-time waitlist and check-in (use a booking platform for that and feed exports here)
Real-World Use Cases
Priya runs a 2-room Hatha and vinyasa studio in Bengaluru. She uses the Yoga & Wellness Studio Dashboard in Excel to track which of her four instructors keep weekday morning attendance highest, and which class types (yin, vinyasa, prenatal) actually clear her rent and instructor pay. Cancellation Rate % by Instructor flagged a teacher whose Sunday classes were quietly losing 22% of bookings — an issue invisible in her Mindbody export.
Marcus operates 4 wellness studio locations across Austin. The Studio Trend page lets him compare Studio Utilization % across all 4 sites month-over-month. Profit Margin % by Studio Location showed his newest North Austin branch running 11 points lower margin than his flagship — a class-mix problem, not marketing. He rebalanced the schedule before signing a 3-year lease extension.
Sarah owns a boutique yoga + meditation studio in Brooklyn. She replaced her $159/month Glofox reporting subscription with this Excel dashboard. Total Revenue Vs Total Attendees by Membership Plan revealed her unlimited-plan members generated lower per-class revenue than 10-class-pack buyers — leading to a pricing reset that lifted average revenue per class by 18%.
Advantages of the Yoga & Wellness Studio Dashboard in Excel
- One-time payment — $17.99 instead of $129–$349/month for Mindbody, Glofox, or Vagaro reporting.
- Owns the data — The file lives on your computer. No vendor lock-in, no migration risk, no surprise pricing changes.
- Standard Excel — No Power Pivot, no Power Query, no third-party add-ins. Works in Excel 2016 and newer on Windows and Mac.
- Profit Margin % built in — A metric that costs extra in most SaaS tools and requires custom DAX in Power BI.
- Multi-location ready — Studio Trend page is designed for operators running 2–10 sites.
- Fully editable — Every chart, color, slicer, and KPI card is open to customization.
Opportunities for Improvement
Honest limitations worth flagging:
- Manual data refresh. The dashboard does not auto-sync with Mindbody, Glofox, or Vagaro. You export a CSV and paste into the Data Sheet — typically a 5-minute weekly task.
- No live booking. This is an analytics file, not a booking platform. Use it alongside your booking SaaS, not instead of it.
- Single-user editing. Excel files don’t co-edit as smoothly as a Google Sheets dashboard. Studios with multiple managers may prefer a Google Sheets equivalent.
- Mobile experience. The Excel mobile app renders pivot charts well but is not as polished as a native SaaS dashboard app.
Best Practices
- Export weekly, not monthly. Weekly exports keep cancellation patterns visible while they are still actionable.
- Keep instructor names consistent. “Maya R.” and “Maya Roy” become two separate instructors in pivot tables — pick one format.
- Track satisfaction every class. A 1–5 rating after each session feeds the Avg. Satisfaction by Instructor metric. Without input, this metric is meaningless.
- Review Profit Margin % monthly, not weekly. Weekly margin numbers are noisy. Monthly trends are decision-grade.
- Use the slicers. The Cancellation Rate by Instructor metric only works when you slice by location and time period together — slicing by one dimension misleads.
Explore Relevant Templates
If you also operate a broader fitness brand, the Gym Fitness Business Dashboard in Excel covers gym memberships and retention. For a focused KPI-card view (MTD/YTD with targets), see the Yoga Studio KPI Dashboard in Excel or the Fitness & Wellness KPI Dashboard in Excel. Coaches and 1:1 wellness practitioners may prefer the Coaching Business Dashboard in Excel. Power BI users can explore the Fitness Studios Dashboard in Power BI.
Frequently Asked Questions
What KPIs does the Yoga & Wellness Studio Dashboard in Excel track?
The Yoga & Wellness Studio Dashboard in Excel tracks 5 headline KPIs — Total Revenue, Net Profit, Total Classes, Total Attendees, Avg. Satisfaction — plus 18 chart-level metrics including Profit Margin % by Class Type, Studio Utilization %, Cancellation Rate % by Instructor, and Avg. Revenue Per Class by Member Type. Every metric updates when you replace the sample data and click Data → Refresh All.
How does this compare to Mindbody, Glofox, or Vagaro?
Mindbody, Glofox, and Vagaro charge $129–$349 per month. The Yoga & Wellness Studio Dashboard in Excel costs $17.99 once. It does not handle live bookings, but if you already use a booking platform you can export class logs into this Excel file for deeper margin and instructor analytics than those tools’ built-in reports.
How long does setup take?
Under 10 minutes. Replace the sample data with your own class log (same column structure), click Data → Refresh All on the Excel ribbon, and all 5 dashboard pages rebuild automatically. No formulas to edit, no DAX to write.
Do I need Power BI or any add-ins?
No. The Yoga & Wellness Studio Dashboard in Excel runs on standard Excel pivot tables. It works in Excel 2016 and newer on Windows and Mac. No Power Pivot, Power Query, or third-party add-ins required.
Will this work for multi-location studios?
Yes. The Studio Trend page and Profit Margin % by Studio Location chart are designed for operators running 2–10 locations. Slicers let you filter to one site at a time or compare all sites side-by-side.
Can I add my own KPIs and class types?
Yes. The Data Sheet is the single source — add new rows, class types, or locations and refresh the pivots. To add a new KPI card, copy any existing card and re-point it to a new pivot range on the Support Sheet.
About the Author
Built by PK — Microsoft Certified Professional with 15+ years of Excel, Google Sheets, and Power BI experience. Founder of NextGenTemplates, reaching 300K+ subscribers across YouTube channels. Every template is hand-built and tested before release.
Conclusion
The Yoga & Wellness Studio Dashboard in Excel is not a replacement for Mindbody, Glofox, or Vagaro — it is a complement. Use those platforms for booking and billing, and use this Excel dashboard for the margin and instructor analytics they don’t surface. For 90% of yoga and wellness studio owners running 50–500 classes per month, the answers they need are already in their class log; this template just makes them visible.
Click here to Purchase the Yoga & Wellness Studio Dashboard in Excel
✅ Instant download · One-time payment · No subscription · Lifetime access
Visit our YouTube channel for step-by-step video tutorials: Youtube.com/@PK-AnExcelExpert
📅 Last updated: April 2026