Print shops that track revenue, profitability, and operator performance in a structured analytics tool identify margin problems 2–3x faster than those relying on manual spreadsheets. The Print Shop Dashboard in Power BI delivers 5 core KPIs, 15+ pre-built visuals, and 5 dedicated analysis pages in a single .pbix file — covering sales trends, product insights, operations, and delivery-type profitability.
Whether you run a digital print shop, a commercial printing operation, or a large-format printing business, this Power BI dashboard template replaces manual reporting with a dynamic, slicer-driven analytics layer. Setup takes under 10 minutes: download the .pbix file, replace the sample data, and every chart, KPI card, and filter refreshes automatically through Power BI’s DAX engine.
➡️ Click here to Purchase the Print Shop Dashboard in Power BI
Key Features of the Print Shop Dashboard in Power BI
- 5 Executive KPI Cards — Total Orders, Total Revenue, Total Cost, Net Profit, and Cancellation Rate on the Overview page, updating in real time as slicers change.
- 15+ Pre-Built Power BI Visuals — Charts covering profit margin by region, completion rate, revenue by print type, monthly trends, payment method, operator performance, product category revenue, and delivery type profitability.
- Multi-Dimensional Slicer Filtering — Filter by date, region, print type, customer type, payment method, delivery type, operator, and color mode on any page.
- 5 Dedicated Analysis Pages — Overview, Sales Trend, Product Insights, Operations, and Profitability.
- Print Industry Coverage — Tracks business cards, banners, brochures, large-format, color and B&W, and custom order categories.
According to Microsoft Power BI documentation, DAX-powered dashboards enable business users to derive insights from data without writing complex queries — exactly what this template delivers for print shop operations.
Dashboard Pages Explanation
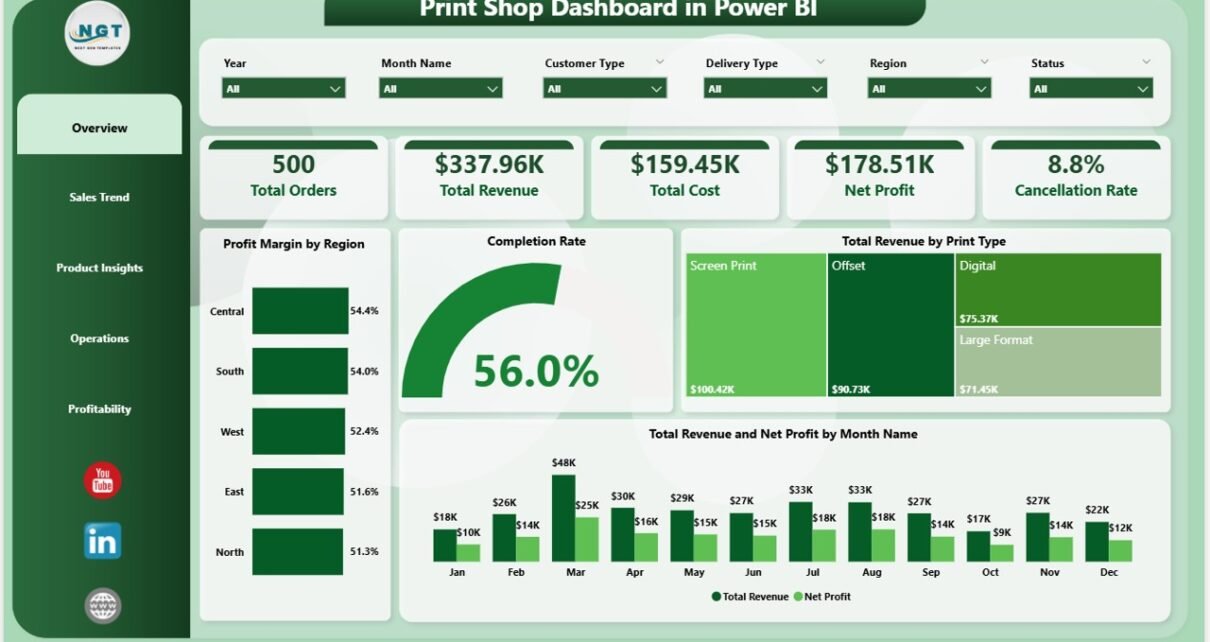
1. Overview Page
The command center with 5 KPI cards: Total Orders, Total Revenue, Total Cost, Net Profit, and Cancellation Rate. Charts include Profit Margin by Region (highest- and lowest-margin geographies), Completion Rate (fulfillment efficiency), Total Revenue by Print Type (income by service category), and Total Revenue and Net Profit by Month (seasonal patterns and margin trends).
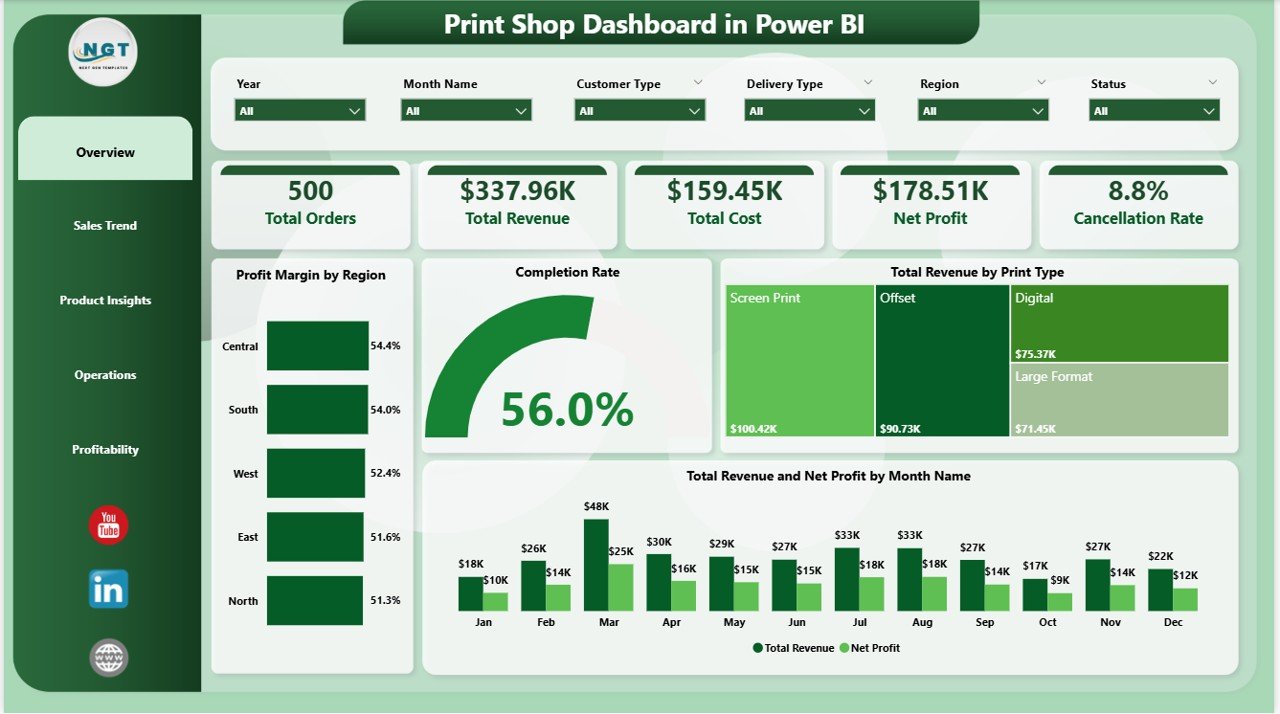
Print Shop Dashboard in Power BI – Overview Page
2. Sales Trend Page
Revenue and order pattern analysis. Total Orders by Payment Method shows preferred payment channels. Net Profit by Print Type isolates the highest-margin service lines. Total Revenue by Customer Type segments income between retail, corporate, and wholesale clients.
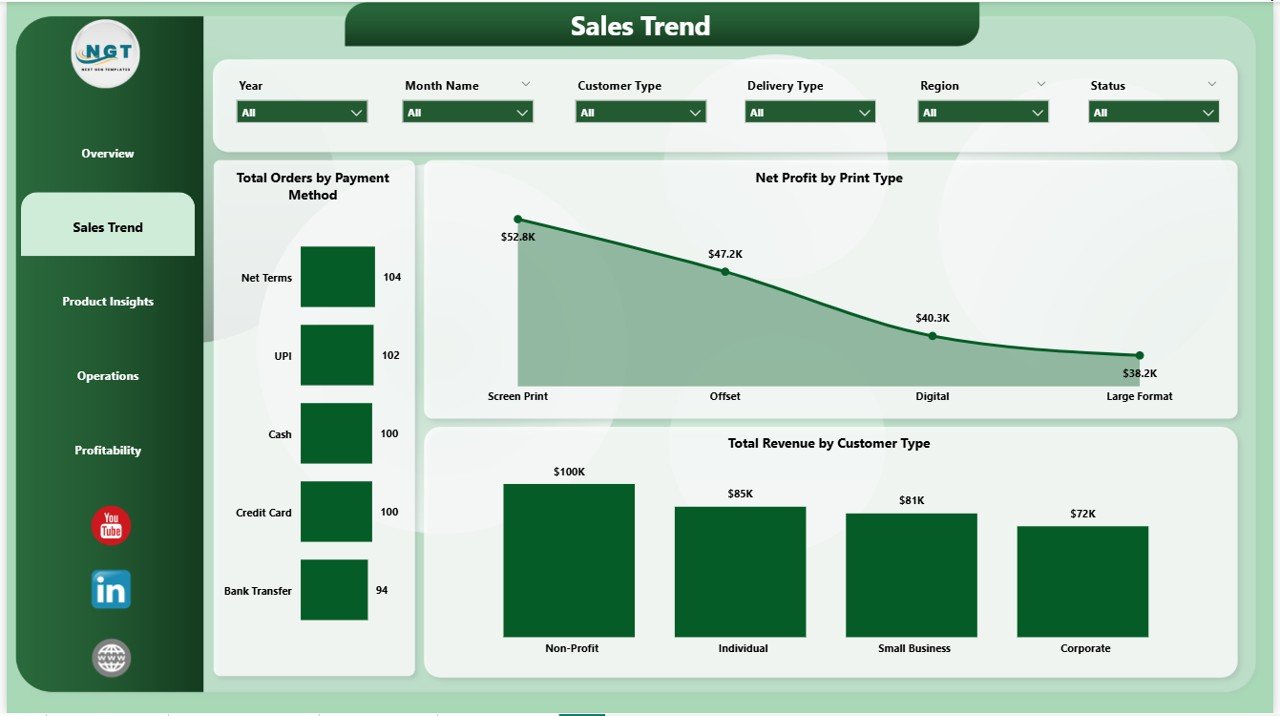
Print Shop Dashboard in Power BI – Sales Trend
3. Product Insights Page
Product-level performance analysis. Total Cost by Print Type highlights cost-heavy service lines. Total Revenue by Color Mode compares color vs. B&W revenue. Total Revenue by Product Category ranks banners, brochures, cards, and large-format prints by income.
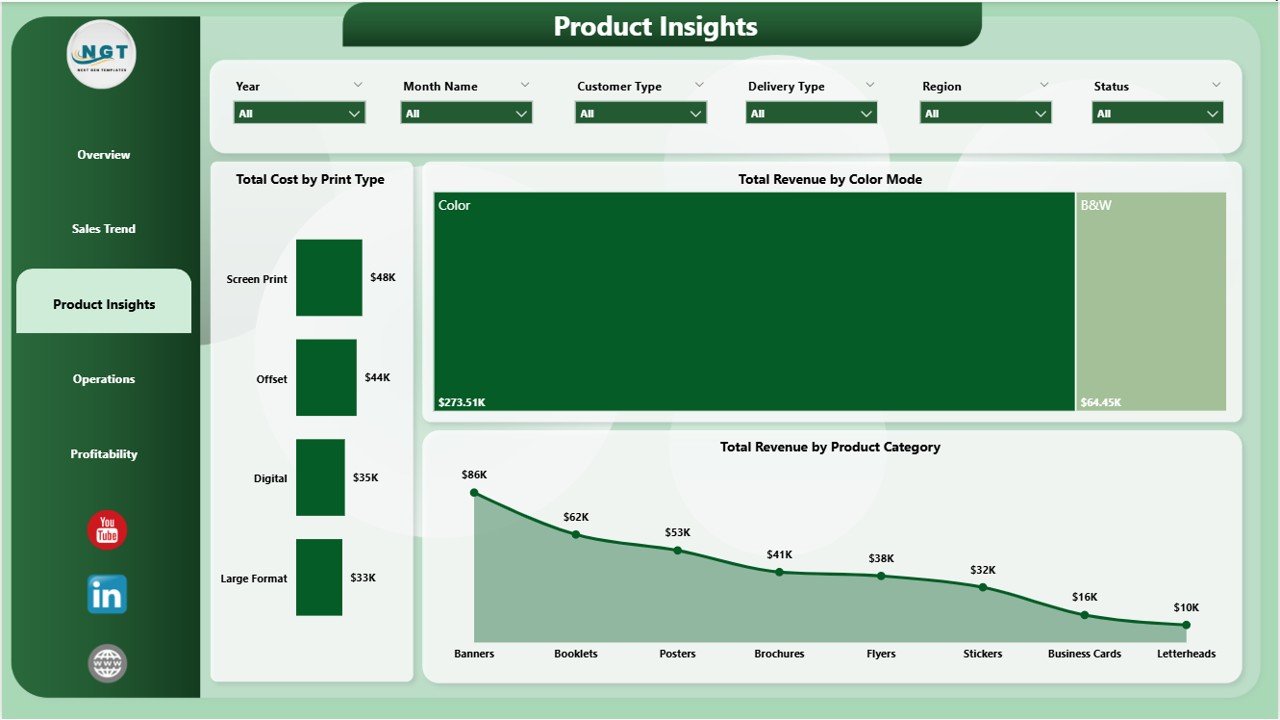
Print Shop Dashboard in Power BI – Product Insights
4. Operations Page
Operator-level and order status tracking. Total Orders by Operator shows workload distribution. Total Revenue by Operator reveals top performers. Total Orders by Status tracks pending, completed, and cancelled orders — a leading indicator of operational efficiency.
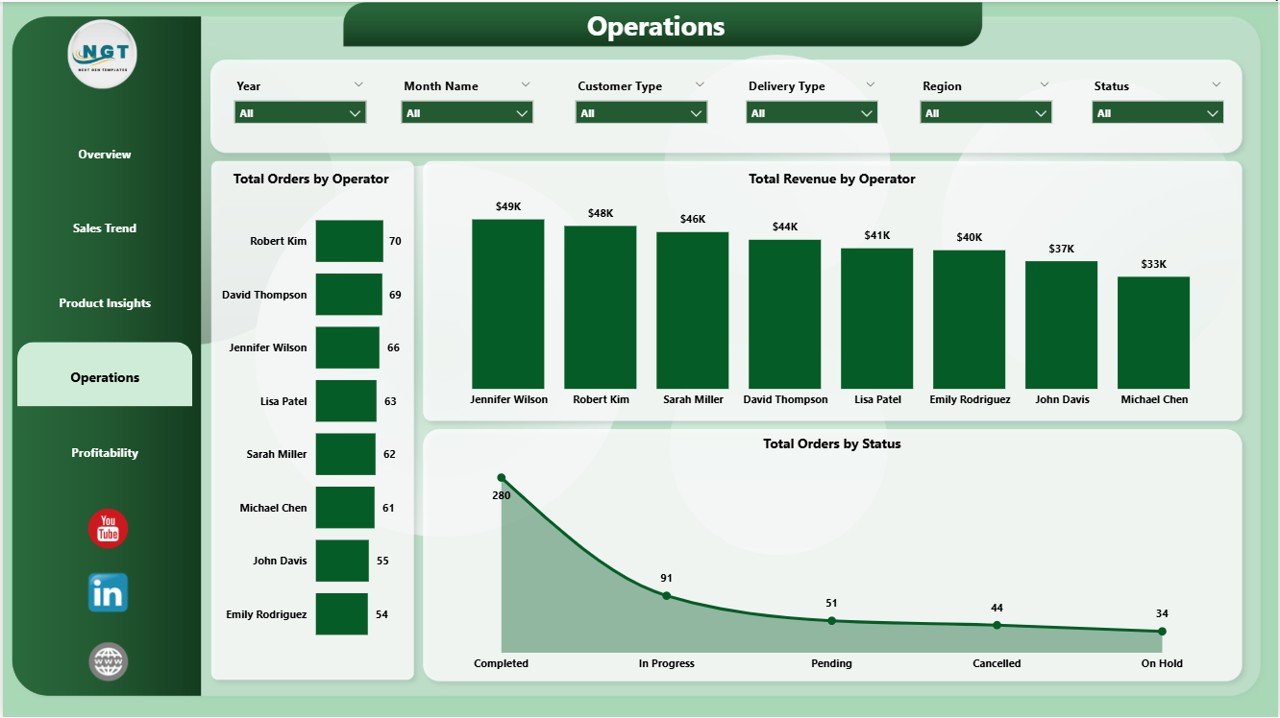
Print Shop Dashboard in Power BI – Operations Page
5. Profitability Page
Deep-dive into margins. Total Revenue and Net Profit by Region compares geographic profitability. Profit Margin by Delivery Type benchmarks standard, express, and pickup channels. Net Profit by Customer Type identifies which segments contribute the most bottom-line value.
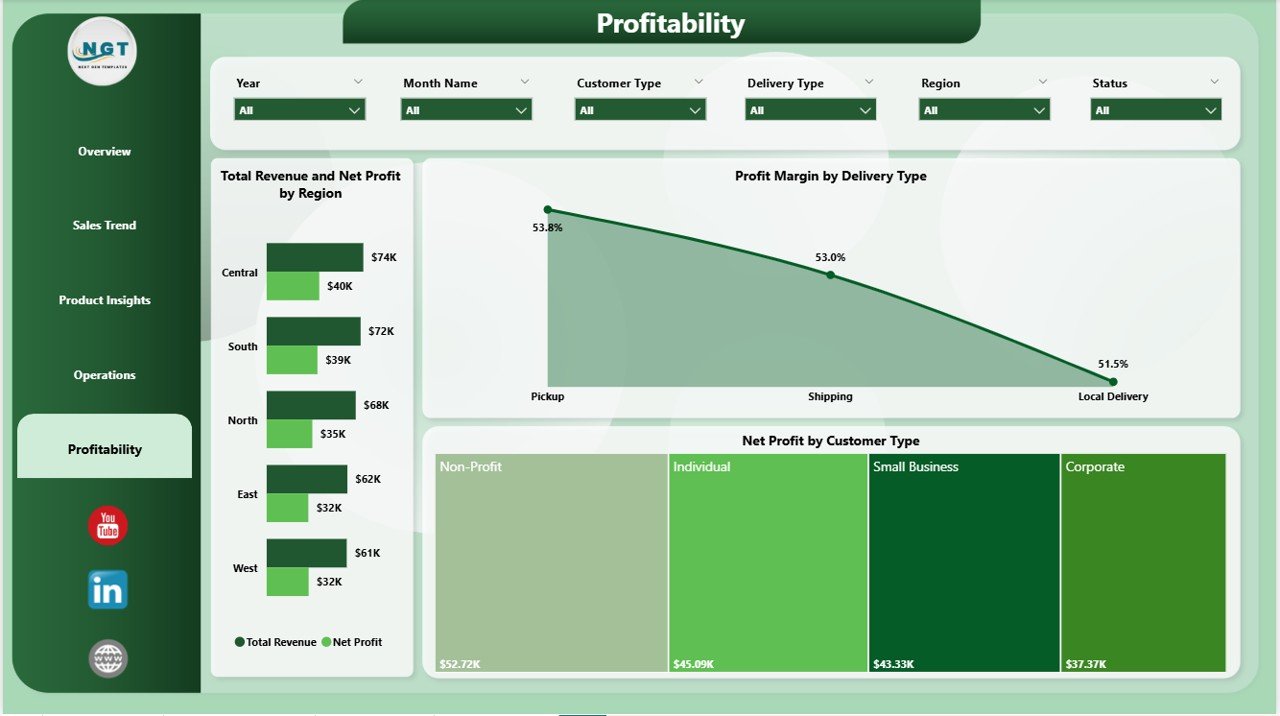
Print Shop Dashboard in Power BI – Profitability Page
Print Shop Dashboard in Power BI vs. Tableau vs. Print MIS — Feature Comparison
| Feature | Print Shop Dashboard in Power BI | Tableau / Qlik | PrintSmith / Printavo |
|---|---|---|---|
| Cost | $17.99 one-time | $70–$900/user/month | $100–$500/user/month |
| Platform | Power BI Desktop (free) | Separate license | SaaS subscription |
| Setup Time | Under 10 minutes | Hours to days | Days to weeks |
| Print-Specific KPIs | ✅ 5 KPIs + 15+ charts | Build from scratch | ✅ |
| Operator Tracking | ✅ Yes | Build from scratch | ✅ |
| One-Time Purchase | ✅ Yes | ❌ Subscription | ❌ Subscription |
| Year-1 Cost (5 users) | $17.99 total | $4,200+ | $6,000+ |
For print shop owners who want professional analytics without a five-figure MIS subscription, this template sits in the sweet spot.
Who Should Use This Template
Perfect for:
- Print shop owners and managers tracking revenue, costs, and profitability
- Operations managers needing operator-level visibility
- Sales analysts monitoring order trends by customer segment and delivery channel
- Print businesses moving from spreadsheet reporting to Power BI analytics
- Print shop consultants who need a ready-to-deploy reporting tool
Not a fit if:
- You need full job ticketing and order management workflow automation
- Your team requires live data streaming or real-time machine connectivity
- Your organization operates entirely outside the Microsoft ecosystem
Real-World Use Cases
Alex manages a mid-sized print shop with 8 operators. He opens the Operations page, applies a date filter, and has the full workload and revenue picture in seconds — without touching a spreadsheet.
Maria runs a commercial printing company serving retail and corporate clients. She used the Profitability page to discover wholesale accounts drove volume but not margin — and adjusted pricing accordingly, recovering an estimated 8% in annual profit leakage.
James is a print shop consultant. He loads 12 months of client data into the template during the first engagement week and delivers a professional Regional Profitability and Completion Rate report on day one.
➡️ Click here to Purchase the Print Shop Dashboard in Power BI
Advantages of the Print Shop Dashboard in Power BI
- Under 10 minutes from download to a fully populated dashboard
- All DAX pre-written — no coding required
- $17.99 one-time vs. hundreds per user per month for comparable SaaS tools
- Fully editable — modify any measure, visual, or color theme in Power BI Desktop
- Cross-page slicer connectivity for multi-dimensional instant filtering
Opportunities for Improvement
This is an analytics reporting layer, not a full print MIS. It does not include job ticketing, client CRM, or automated invoicing. Shops needing live data refresh without manual CSV imports will need to configure a Power BI dataflow or direct database connection. Operations with highly specialized data structures may want to add custom DAX measures.
Best Practices
- Update data monthly so seasonal trend charts provide the most actionable insights
- Watch Cancellation Rate as a leading indicator — a rising rate flags pricing or workflow issues early
- Check Profit Margin by Delivery Type quarterly — delivery cost shifts are a common margin leak this chart catches fast
- Pair with the Print Shop Dashboard in Excel for teams that prefer pivot-based reporting
Explore Relevant Templates
- Print Shop Dashboard in Excel — same 5 pages, powered by pivot tables and SUMIFS
- Sports Team Dashboard in Power BI — operator tracking adapted for sports management
- Pricing Strategy KPI Dashboard in Power BI — ideal complement for print pricing analysis
- All Power BI Dashboard Templates — full library across industries
Frequently Asked Questions
What KPIs does the Print Shop Dashboard in Power BI track?
The Print Shop Dashboard in Power BI tracks 5 KPIs: Total Orders, Total Revenue, Total Cost, Net Profit, and Cancellation Rate. Dynamic cards on the Overview page recalculate instantly as slicers are applied across all five pages.
Do I need a Power BI license?
No. Power BI Desktop is free from Microsoft. A Pro license ($10/user/month) is only needed to share the dashboard via Power BI Service with other team members.
Can I customize the DAX measures and visuals?
Yes. Modify any DAX measure, add calculated columns, change visual types, or adjust colors. Basic customization requires no advanced DAX knowledge.
How does this compare to PrintSmith or Printavo?
The Print Shop Dashboard in Power BI costs $17.99 once versus $100–$500/user/month for full print MIS platforms. It is an analytics layer without order management or invoicing — right for shops that have an operational system and need better reporting.
How long does setup take?
Under 10 minutes. Download the .pbix file, open in Power BI Desktop, replace sample data, and all 15+ visuals and 5 KPI cards refresh automatically.
Is there an Excel version?
Yes. The Print Shop Dashboard in Excel uses pivot tables and SUMIFS, covering the same 5 analysis pages and KPIs.
What file format is delivered?
A .pbix file — the standard Power BI Desktop format. It opens directly in Power BI Desktop with no additional plugins required.
About the Author
Built by PK — Microsoft Certified Professional with 15+ years of Excel, Google Sheets, and Power BI experience. Founder of NextGenTemplates, reaching 300K+ subscribers across YouTube. Follow for weekly Power BI and Excel tutorials at Youtube.com/@PK-AnExcelExpert.
Conclusion
The Print Shop Dashboard in Power BI gives print shop owners and managers a professional analytics tool covering every dimension of their business in a single .pbix file for a one-time cost of $17.99.
➡️ Click here to Purchase the Print Shop Dashboard in Power BI
✅ Instant download · One-time payment · No subscription · Lifetime access
📅 Last updated: May 2026