The global cement industry produces over 4.1 billion metric tonnes annually, with demand driven by infrastructure growth across Asia, Africa, and Latin America (USGS Mineral Commodity Summaries, 2024). Yet most mid-sized cement manufacturers, distributors, and regional sales operations still rely on fragmented spreadsheets, email-based reports, and weekly manual summaries to track revenue, profitability, and plant performance. That lag — between the transaction and the insight — costs margin, delays decisions, and hides the signals that matter most.
The Cement Products Dashboard in Excel closes that gap with a 5-page analytics template that tracks 5 core KPI cards and 16 pre-built charts covering sales trends, product mix, channel behavior, and operations — all powered by native Excel pivot tables that refresh with a single click. No Power BI subscription, no per-user licensing, no IT handholding.
Key Features of the Cement Products Dashboard in Excel
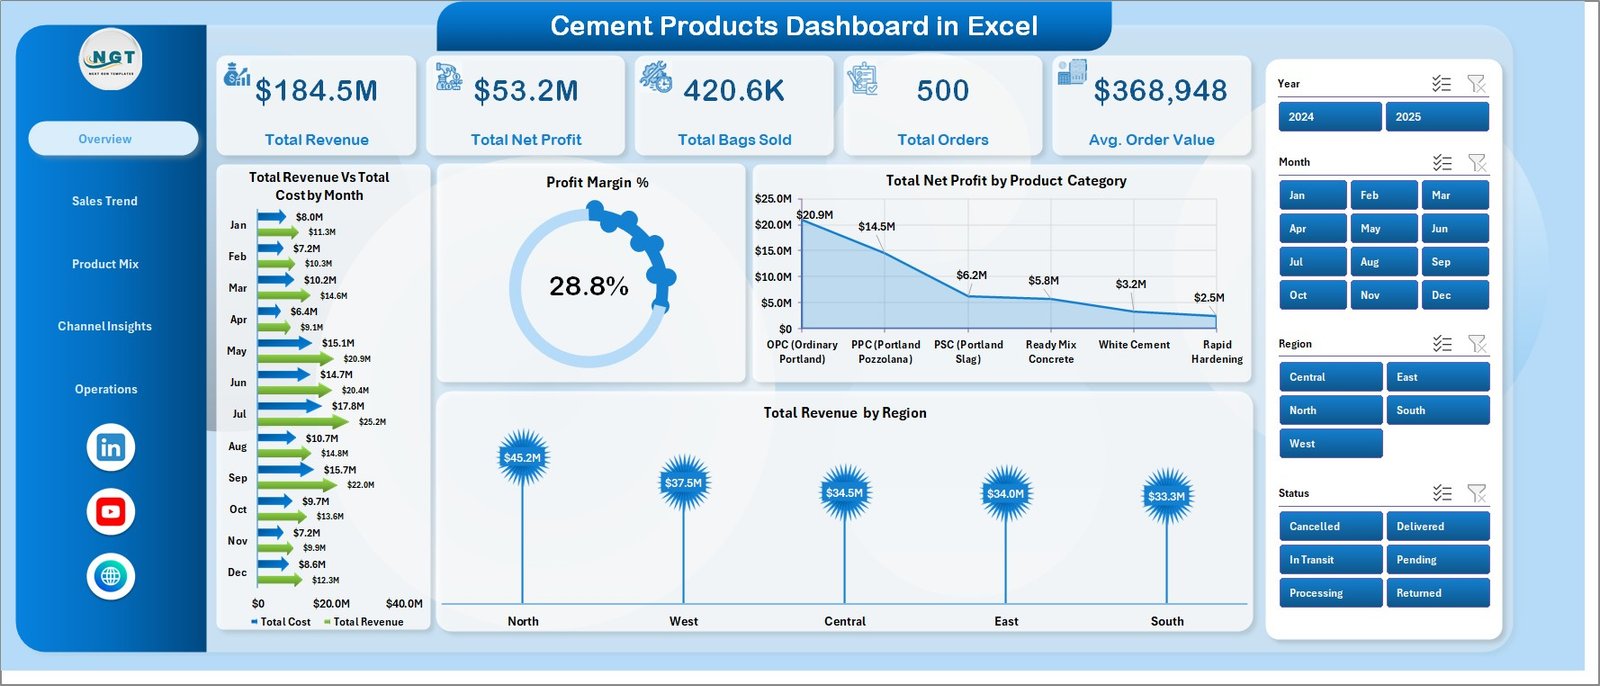
- 5 analysis pages: Overview, Sales Trend, Product Mix, Channel Insights, and Operations — each with its own slicers and charts
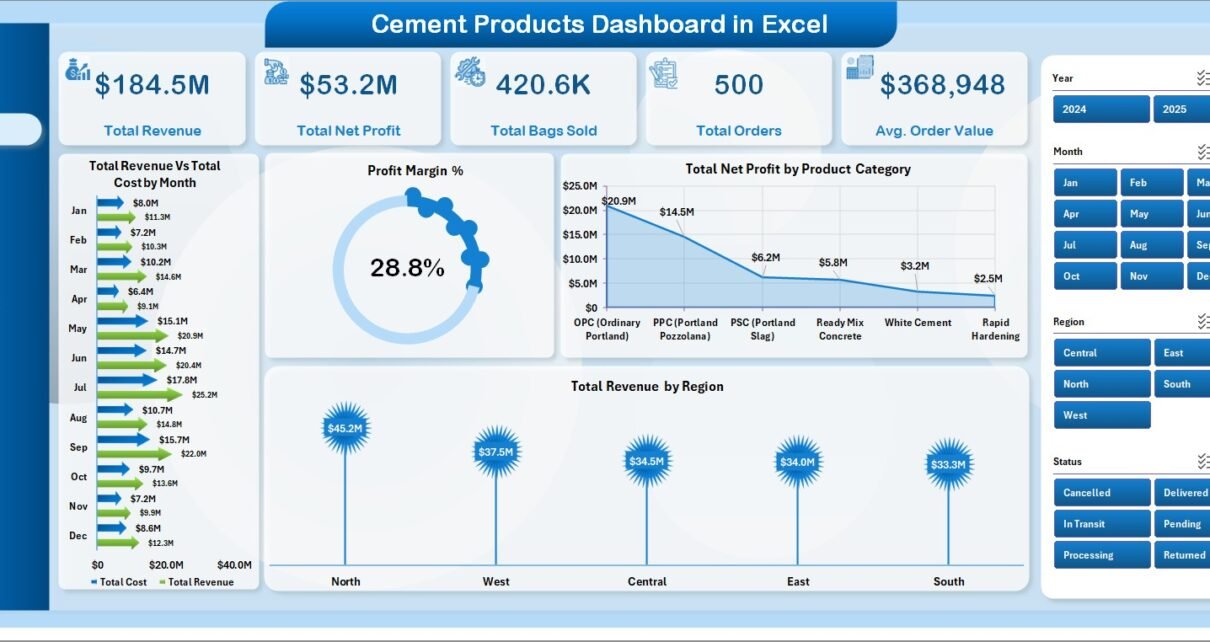
- 5 KPI cards on the Overview page: Total Revenue, Total Net Profit, Total Bags Sold, Total Orders, and Avg. Order Value
- 16 pre-built charts covering revenue vs cost, profit margin trends, regional breakdowns, quality grade analysis, and plant performance
- Multiple slicers on every page for instant filtering by region, product category, customer type, payment method, and more
- Pivot-driven architecture: update data, click Refresh All, and every chart across all 5 pages updates automatically
- Data Sheet with structured input fields — just add rows in the same format as the sample data
- Support Sheet with all underlying pivots — keep it hidden from end users for a cleaner presentation
- No macros, no add-ins — works with Excel 2016, 2019, 2021, and Microsoft 365, online or offline
Dashboard Pages Explanation
Page 1: Overview
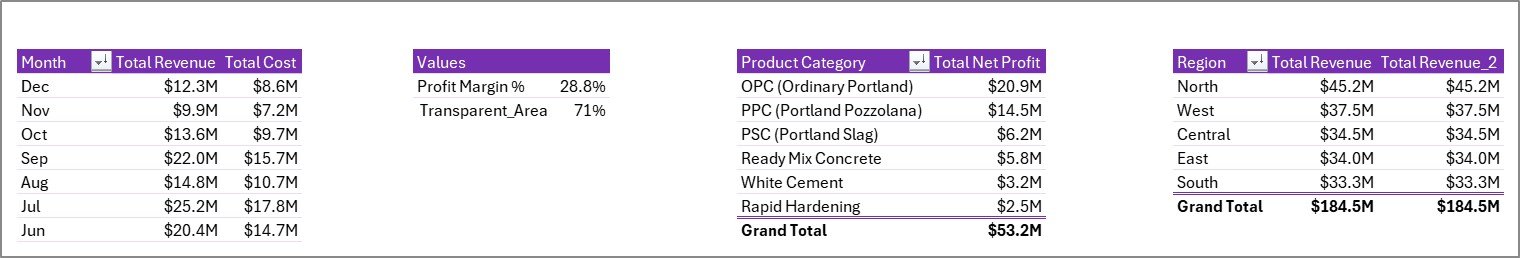
The Overview page is the command center for cement sales performance. It displays 5 KPI cards (Total Revenue, Total Net Profit, Total Bags Sold, Total Orders, Avg. Order Value) at the top, giving any manager an immediate snapshot of business health. Four charts provide deeper context: Total Revenue vs Total Cost by Month shows monthly gross margin trends, Profit Margin % tracks profitability over time, Total Net Profit by Product Category identifies which cement grades contribute most to the bottom line, and Total Revenue by Region reveals geographic revenue concentration. Multiple slicers let you apply filters across the entire page instantly.
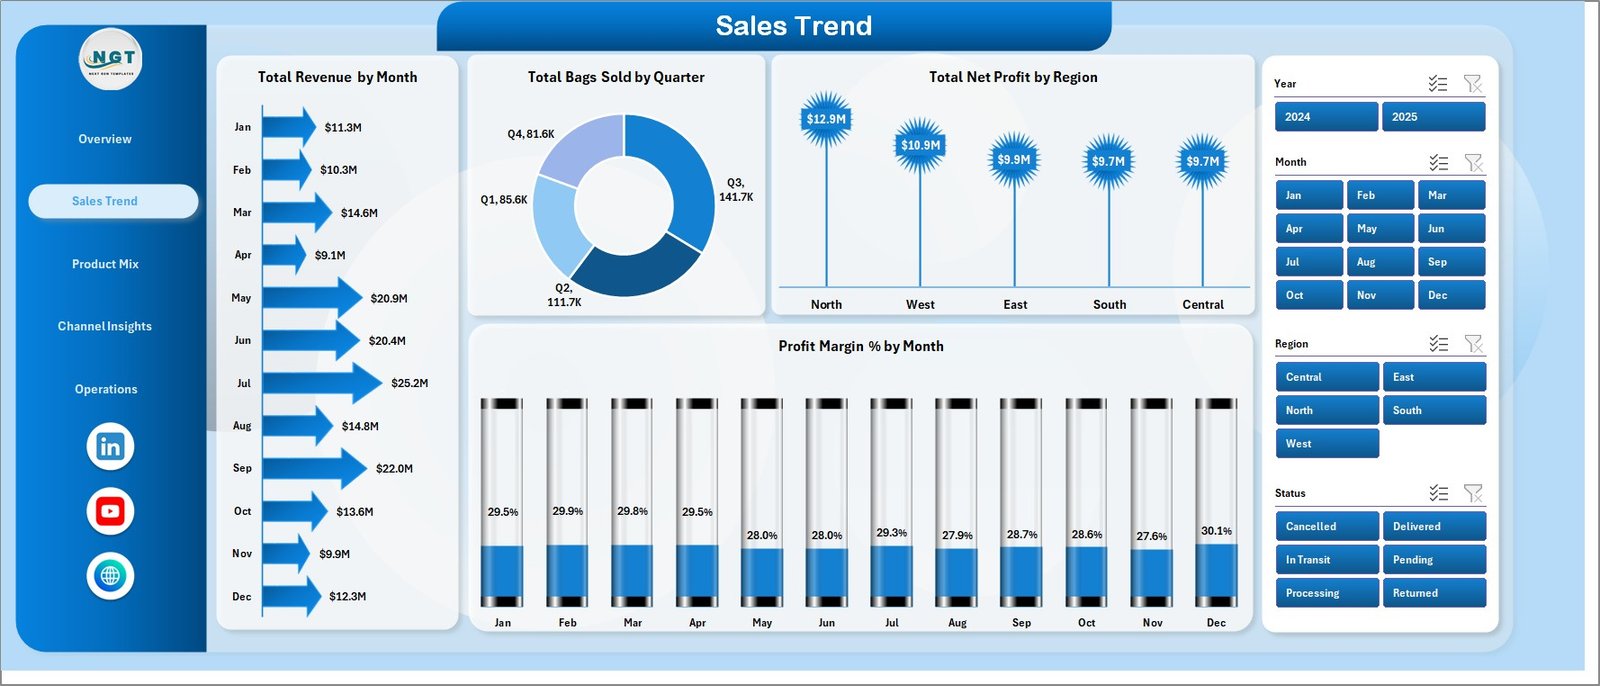
Page 2: Sales Trend
The Sales Trend page focuses on time-series and regional performance. Total Revenue by Month surfaces seasonal patterns in cement demand, while Total Bags Sold by Quarter gives a volume lens on the same data. Total Net Profit by Region helps operations leaders understand where margin is strongest geographically. Profit Margin % by Month shows whether margins are expanding or compressing over time — critical for pricing decisions in a commodity business.
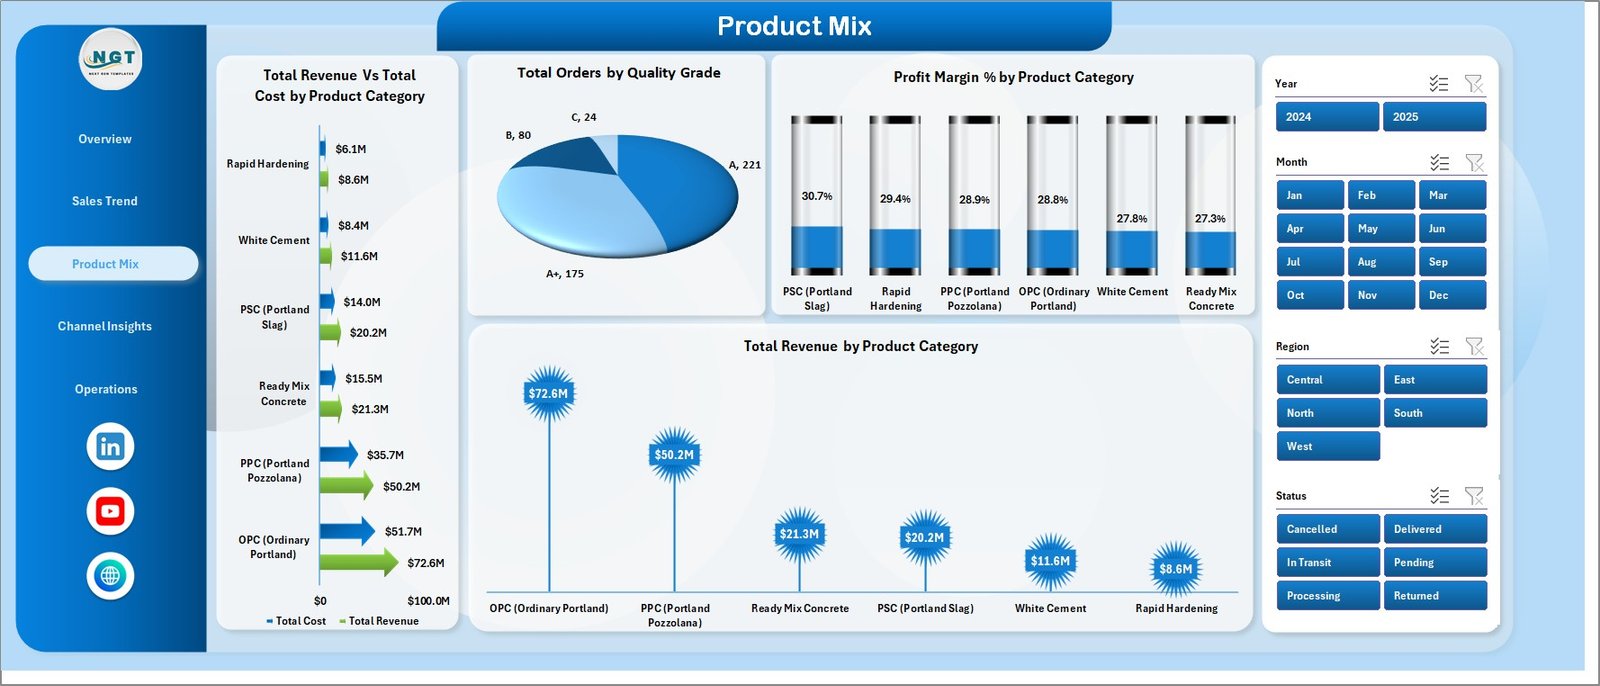
Page 3: Product Mix
The Product Mix page provides a granular view of performance by cement category and quality grade. Total Revenue vs Total Cost by Product Category exposes which grades have the tightest margins. Total Orders by Quality Grade shows demand concentration. Profit Margin % by Product Category and Total Revenue by Product Category together give product managers everything they need to optimize the portfolio and prioritize high-margin SKUs.
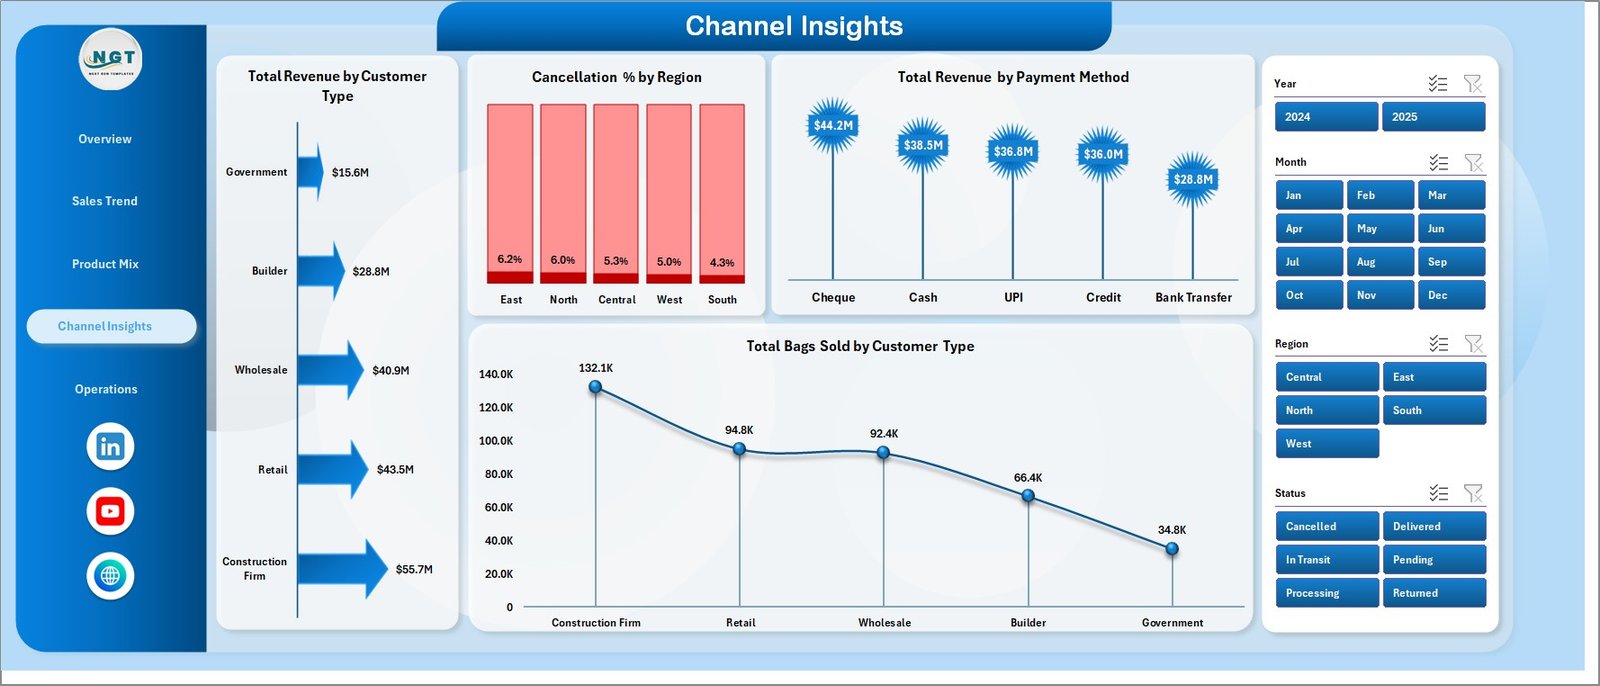
Page 4: Channel Insights
Channel Insights answers the questions sales managers care about most: who is buying, how are they paying, and where are we losing orders? Total Revenue by Customer Type and Total Bags Sold by Customer Type reveal whether retail, wholesale, or institutional customers drive the business. Total Revenue by Payment Method informs credit and collection policy. Cancellation % by Region is the standout metric — high cancellation rates in specific regions signal logistics, credit, or demand issues before they hit the P&L.
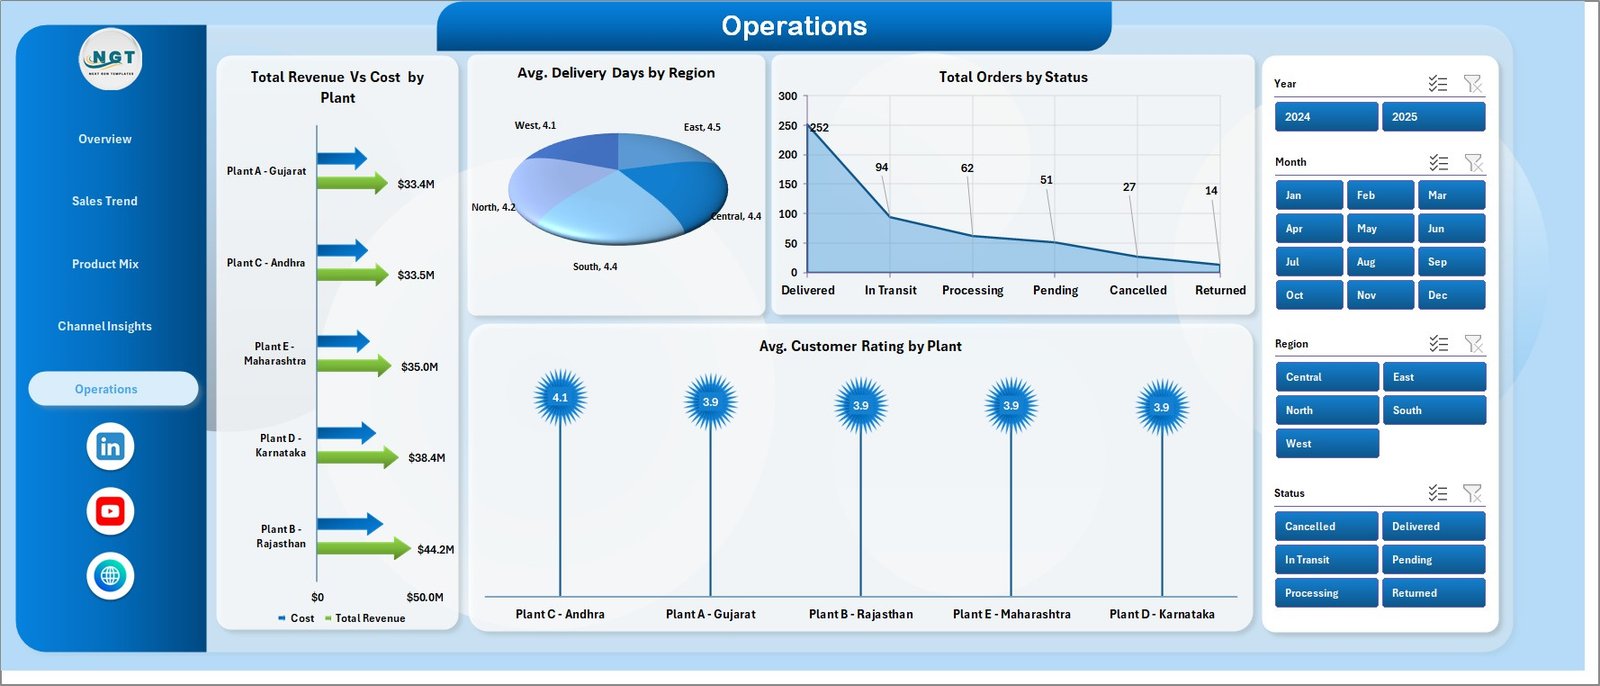
Page 5: Operations
The Operations page shifts focus from commercial to operational performance. Total Revenue vs Cost by Plant enables plant-level profitability comparison. Avg. Delivery Days by Region highlights logistics bottlenecks. Total Orders by Status gives a pipeline view of fulfilled vs pending vs cancelled orders. Avg. Customer Rating by Plant is a leading indicator of service quality and retention risk.
Data Sheet
The Data Sheet is where you input your transaction records. It follows a structured column format — date, region, plant, product category, quality grade, customer type, payment method, bags sold, revenue, cost, delivery days, order status, and customer rating. Replace the sample data with your own records, then click Data → Refresh All to update everything at once.

Support Sheet
The Support Sheet contains all the underlying pivot tables that feed every chart across all 5 dashboard pages. It can be hidden from end users. When new data is added to the Data Sheet, a single Refresh All command in the Excel Ribbon refreshes every pivot and every chart simultaneously.
Cement Products Dashboard in Excel vs. Google Sheets vs. Power BI / Tableau — Feature Comparison
| Feature | Cement Products Dashboard in Excel | Google Sheets Equivalent | Power BI / Tableau |
|---|---|---|---|
| Cost | $17.99 one-time ✅ | $0 (Google account needed) | $10–$20/user/month (Power BI Pro) or $75+/user/month (Tableau) |
| Platform | Microsoft Excel, offline ✅ | Browser-based, online only | Requires Power BI Desktop or Tableau Desktop |
| Setup time | Under 10 minutes ✅ | Under 10 minutes | Hours to days for data modeling |
| Works offline | Yes ✅ | No | Power BI Desktop yes; service requires internet |
| Customizable fields | Fully customizable ✅ | Yes | Yes, with DAX / calculated fields |
| No per-user fees | Yes ✅ | Yes | No — per-user licensing required |
| One-click data refresh | Yes — Refresh All ✅ | Yes | Yes (dataset refresh) |
| Year-1 cost at 5 users | $17.99 total ✅ | $0 | $600–$4,500+ |
For cement sales teams that need offline-ready, shareable analytics without Power BI licensing costs, the Cement Products Dashboard in Excel sits in the sweet spot.
Who Should Use This Template
Perfect for:
- Cement manufacturers tracking revenue, profit, and volume across product categories
- Regional sales managers at cement distributors who need region and customer-type breakdowns
- Plant operations managers comparing performance, delivery days, and customer ratings by plant
- Finance and reporting teams at building materials companies building monthly dashboards
- Business analysts at SMB cement firms looking to replace manual Excel reports with structured analytics
Not a fit if:
- You need real-time ERP integration with SAP, Oracle, or production IoT systems
- Your team requires simultaneous multi-user editing with row-level data security
- You need automated daily refresh from cloud data warehouses
Real-World Use Cases
Arun manages regional sales for a cement manufacturer in South India. He uses the Cement Products Dashboard to build his weekly sales report for the VP — total revenue by region, bags sold by category, and margin trends by month — without waiting on IT for a Power BI dataset refresh. The whole process takes 10 minutes: paste new data, click Refresh All, export to PDF, done.
A procurement analyst at a mid-sized building materials distributor uses the Channel Insights page to monitor cancellation rates by region. In month two, she spotted a 34% cancellation rate in one region — traced to a credit policy issue — and worked with the sales team on a corrective action that brought the rate down to 18% within a quarter.
A plant operations manager at a 3-plant cement company uses the Operations page to compare Avg. Customer Rating and Avg. Delivery Days by plant in one view. A persistent gap between Plant 1 (4.6 stars, 2.1 days) and Plant 3 (3.8 stars, 4.3 days) became the basis for a logistics improvement project that reduced Plant 3’s delivery days by 1.2 days over 90 days.
Advantages of the Cement Products Dashboard in Excel
- One-time cost, no subscriptions — $17.99 replaces recurring BI tool licensing for the entire team
- Works offline — no internet required; safe for plant-level or field environments
- Instant refresh — pivot tables update all 5 pages and 16 charts with a single Refresh All click
- Multi-dimensional analysis — covers sales, product, channel, and operations in one file
- Fully customizable — add regions, plants, categories, or quality grades without breaking anything
- Shareable — send via email, OneDrive, or SharePoint; no account required to view
Opportunities for Improvement
- No automatic data import — data must be entered or pasted manually into the Data Sheet
- No real-time connectivity — does not pull live data from SAP, Oracle, or ERP systems
- Multi-user simultaneous editing requires OneDrive or SharePoint (not available in standalone Excel desktop)
- Chart formatting changes after adding new categories may require manual slicer/pivot refresh
For teams needing ERP integration, automated refresh, or enterprise-grade access control, Power BI or Tableau are better fits. For the majority of cement SMBs running on Excel already, this template closes the analytics gap immediately.
Best Practices
- Match your column format exactly when replacing sample data — pivot tables are sensitive to column names
- Click Refresh All after every data update — do not rely on auto-calculate for pivot tables
- Keep the Support Sheet hidden when sharing the file with non-analysts to prevent accidental pivot edits
- Archive monthly versions by saving a copy with the month-year in the filename before adding new data
- Use the Cancellation % by Region chart as a leading indicator — rising cancellations precede revenue shortfalls by 4–6 weeks in most cement businesses
- Review the Avg. Customer Rating by Plant monthly alongside delivery days — the two metrics together predict churn risk better than either alone
Explore Relevant Templates
- Cement Products Dashboard in Excel — download the template directly
- 3D Printing Manufacturing KPI Dashboard in Excel — for additive manufacturing operations
- Adhesives and Sealants KPI Dashboard in Excel — specialty chemicals manufacturing analytics
- Prosthetics Manufacturing KPI Dashboard in Excel — manufacturing performance for healthcare products
- All Manufacturing Templates — full catalog of dashboards across manufacturing sub-industries
Also explore Microsoft’s official guidance on Excel PivotTables for working with and refreshing pivot-driven reports.
Frequently Asked Questions
What KPIs does the Cement Products Dashboard in Excel track?
The Cement Products Dashboard in Excel tracks 5 core KPIs: Total Revenue, Total Net Profit, Total Bags Sold, Total Orders, and Average Order Value. These appear as card metrics on the Overview page and are broken down across 5 analysis tabs covering sales trends, product mix, channel behavior, and plant operations.
Does this dashboard require Power BI or any Excel add-ins?
No — the Cement Products Dashboard in Excel runs on native Excel pivot tables, slicers, and charts. No Power BI, no add-ins, no macros required. It works offline and is compatible with Excel 2016, 2019, 2021, and Microsoft 365.
How long does initial setup take?
Setup takes under 10 minutes. Open the file, clear the sample data rows in the Data Sheet, paste or enter your transaction records in the same column format, then click Data → Refresh All. All 5 dashboard pages and 16 charts update instantly.
Can I customize the regions, product categories, or plants?
Yes — add new rows to the Data Sheet with your own region names, category names, or plant names in the appropriate columns. After clicking Refresh All, the pivot tables pick up the new values automatically and they appear in all relevant charts and slicers.
How does this compare to a Power BI cement dashboard?
The Cement Products Dashboard in Excel is a one-time $17.99 purchase with no per-user licensing. Power BI Pro costs $10/user/month ($600/year for 5 users) and requires a Power BI Gateway for on-premises data. For teams already working in Excel, this template is faster to deploy and substantially cheaper.
Can I share the file with colleagues?
Yes — share via email, OneDrive, SharePoint, or Google Drive. For simultaneous co-editing, save to OneDrive and open in Excel for the web. For single-user desktop use, standard Excel works perfectly with no additional setup.
What version of Excel does this require?
The Cement Products Dashboard in Excel is compatible with Excel 2016 and later, including Excel 2019, Excel 2021, and all Microsoft 365 versions. It does not require Excel 365 exclusive functions.
About the Author
Built by PK — Microsoft Certified Professional with 15+ years of Excel, Google Sheets, and Power BI experience. Founder of NextGenTemplates, reaching 300K+ subscribers across YouTube channels. Every template is hand-built and tested before release.
Conclusion
Cement sales analytics doesn’t have to mean a six-month Power BI project or a $600/year subscription. The Cement Products Dashboard in Excel gives cement manufacturers, distributors, and operations teams a structured, 5-page analytics view of revenue, profitability, product mix, channel performance, and plant operations — ready in under 10 minutes, customizable without a developer, and shareable without per-user fees.
Click here to Purchase Cement Products Dashboard in Excel
Instant download · One-time payment · No subscription
Last updated: May 2026
👉 Subscribe to Youtube.com/@PK-AnExcelExpert for weekly Excel dashboard tutorials and template walkthroughs.
For related reading, see our posts on the Auto Repair Dashboard in Excel and the Packaging Machine Downtime Dashboard in Power BI.