Startup programs, accelerators, and coworkation hubs often track bookings, workspace usage, revenue, cost, and participant experience in separate files. That creates a reporting gap: teams may know how many startups joined a program, but not which region, hub, funding stage, or lead source is creating the best revenue and gross profit outcomes. The Coworkation Startups Dashboard in Power BI solves that gap with 5 interactive report pages, 5 KPI cards, and 16+ visuals built for coworkation and startup ecosystem reporting.
This PBIX template works in Power BI Desktop and can be adapted for your own startup, hub, booking, and program data. You can learn more about Power BI Desktop from Microsoft Learn.
Click here to purchase the Coworkation Startups Dashboard in Power BI
Key Features of Coworkation Startups Dashboard in Power BI
The dashboard is designed around the questions coworkation leaders ask most often: How much workspace capacity are we using? Which programs drive the most revenue? Which regions produce the best gross profit? Which startup segments are growing? Which hubs create the best participant experience?
- 5 KPI cards: Workspace Utilization Rate, Total Workspace Days, Total Revenue, Total Cost, and Gross Profit.
- 5 Power BI report pages: Overview, Booking Trend, Market Segments, Program Insights, and Experience Quality.
- 16+ visual analysis points: revenue, startups, gross profit, workspace days, NPS, funding stage, industry, status, region, month, quarter, lead source, and coworkation hub.
- Interactive slicers: filter the dashboard quickly by relevant program, geography, hub, status, time, or startup dimensions.
- Editable PBIX structure: update visuals, measures, relationships, colors, and source connections in Power BI Desktop.
Dashboard Pages Explanation
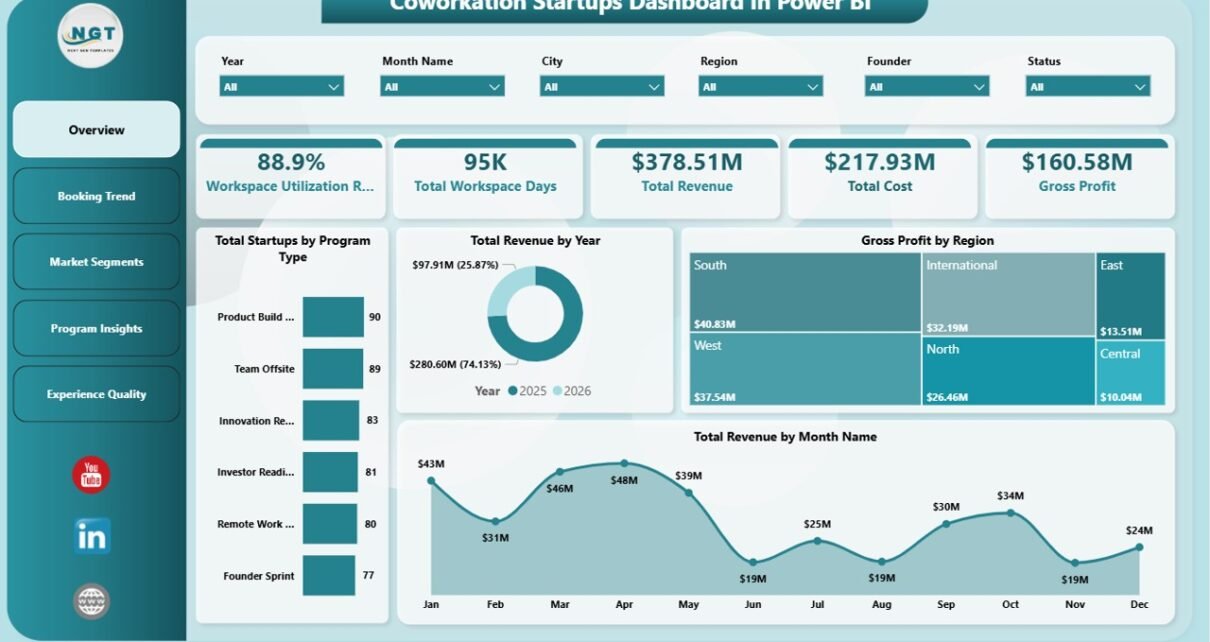
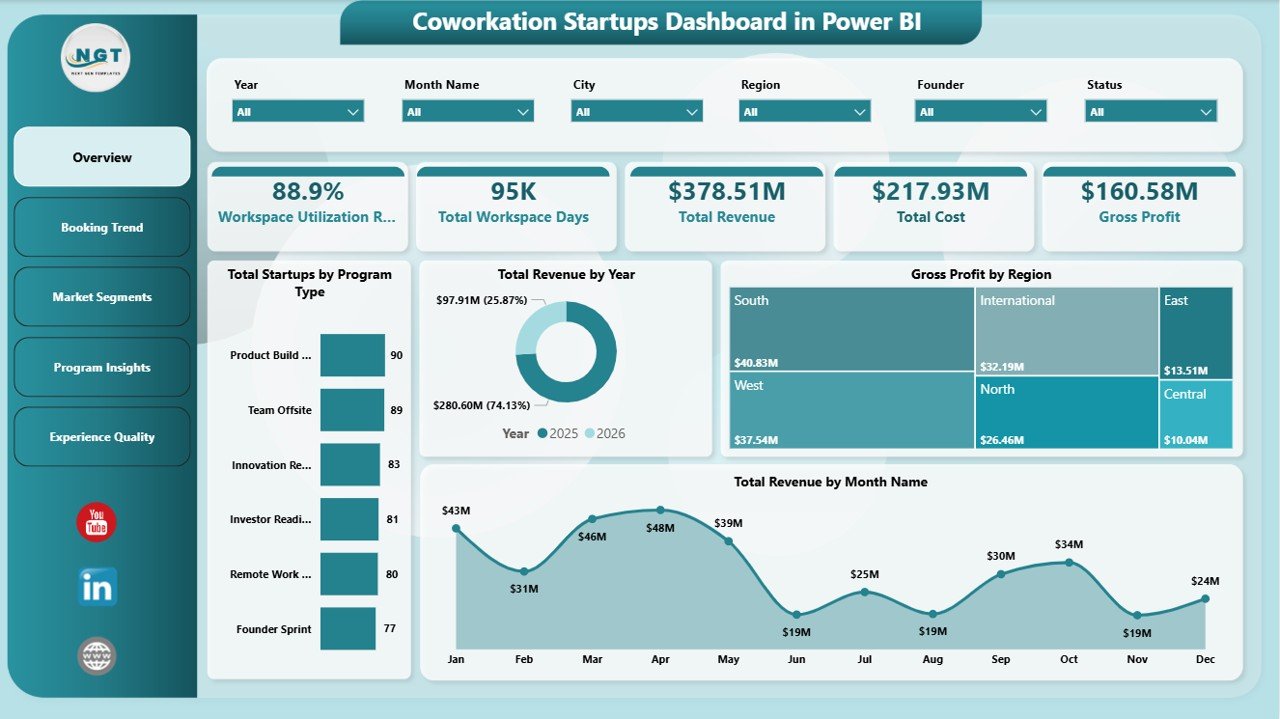
Page 1: Overview
The Overview page is the executive summary of the Coworkation Startups Dashboard in Power BI. It starts with five KPI cards for Workspace Utilization Rate, Total Workspace Days, Total Revenue, Total Cost, and Gross Profit, giving managers a high-level view of operational scale and financial health.
Total Startups by Program Type shows which coworkation formats attract the most startup participation. This helps managers compare accelerators, residencies, retreats, or other programs before adjusting capacity or marketing focus.
Total Revenue by Year reveals long-term revenue movement. Use it to understand whether your coworkation model is scaling, flat, or seasonal over multiple reporting years.
Gross Profit by Region compares margin contribution across geographies. This is helpful when deciding which regions deserve more investment, partnerships, or hub expansion.
Total Revenue by Month Name displays monthly revenue seasonality. It helps teams prepare for strong and weak booking months before they affect cash flow.
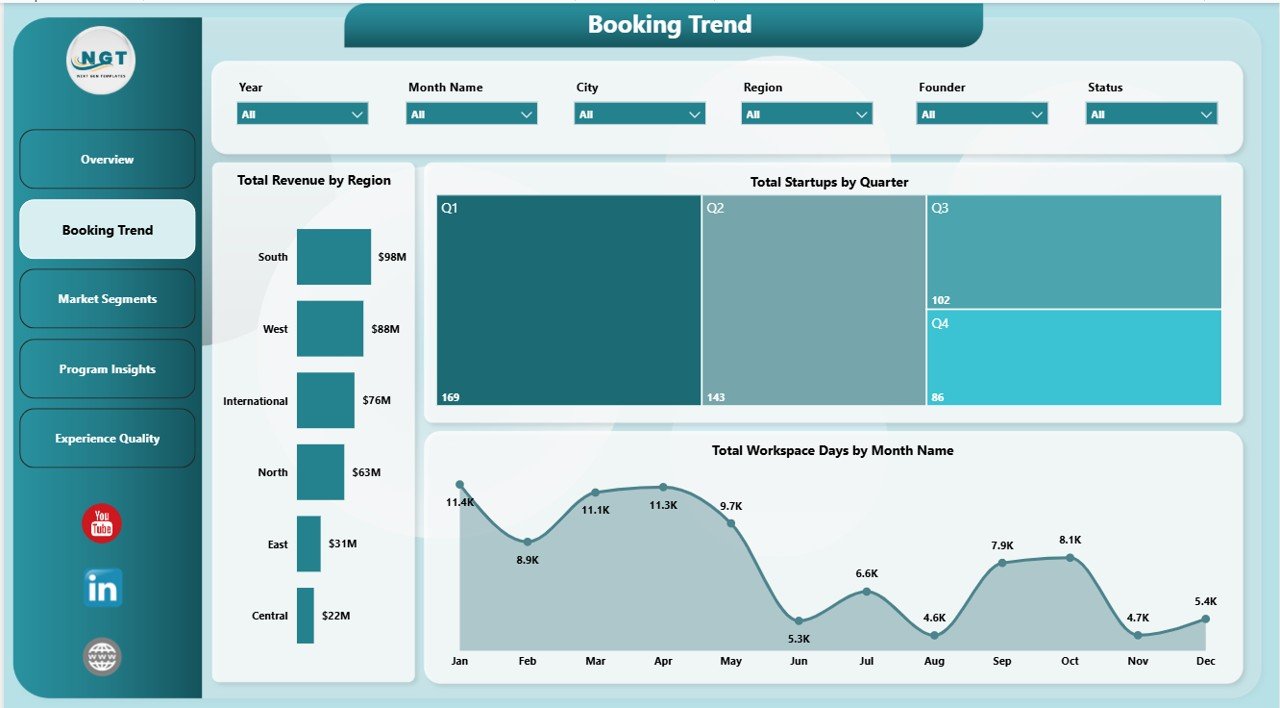
Page 2: Booking Trend
The Booking Trend page focuses on revenue distribution, startup movement, and workspace usage over time. Total Revenue by Region shows which markets produce the strongest income. Total Startups by Quarter highlights quarterly participation momentum and makes it easier to spot program seasonality. Total Workspace Days by Month Name shows how much workspace demand changes month by month, which helps with hub staffing, room planning, and capacity decisions.
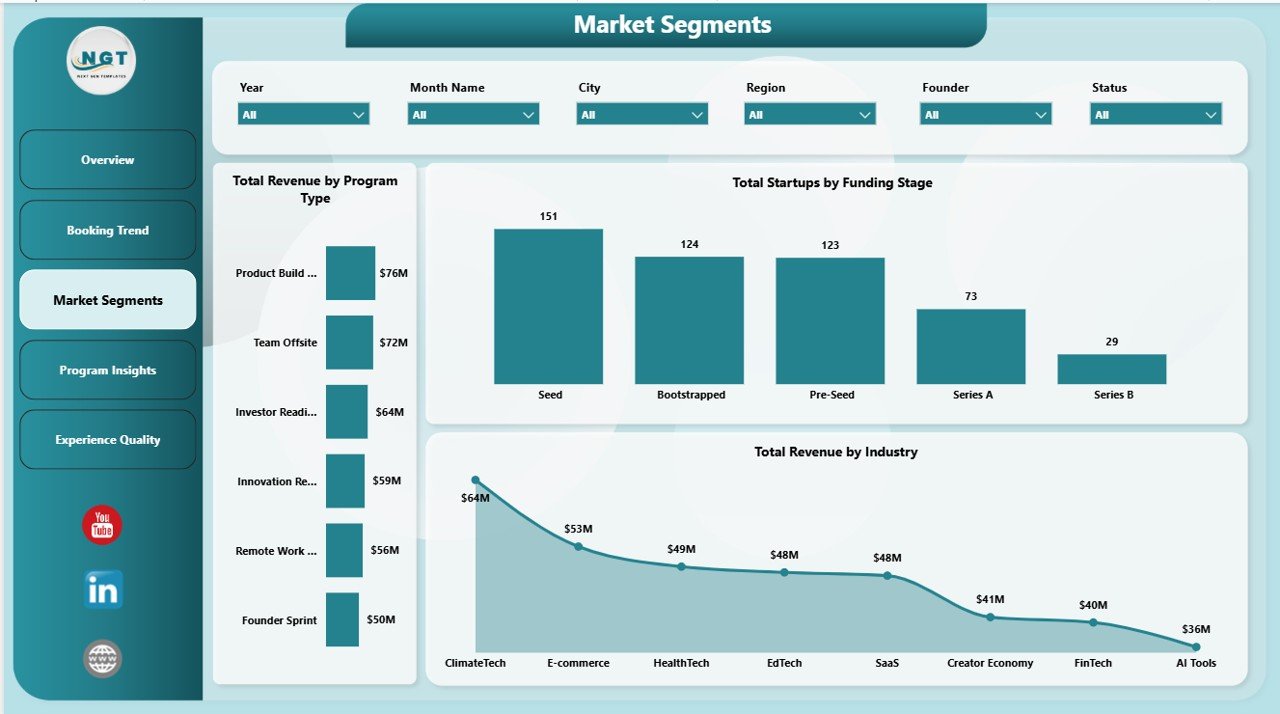
Page 3: Market Segments
The Market Segments page is useful for understanding which audiences and program categories bring commercial value. Total Revenue by Program Type compares revenue contribution across coworkation offerings. Total Startups by Funding Stage shows whether your hub serves idea-stage, seed, Series A, or later-stage companies. Total Revenue by Industry reveals which sectors create the most revenue, helping teams refine partnerships, sales messaging, and community programming.
Click here to purchase the Coworkation Startups Dashboard in Power BI
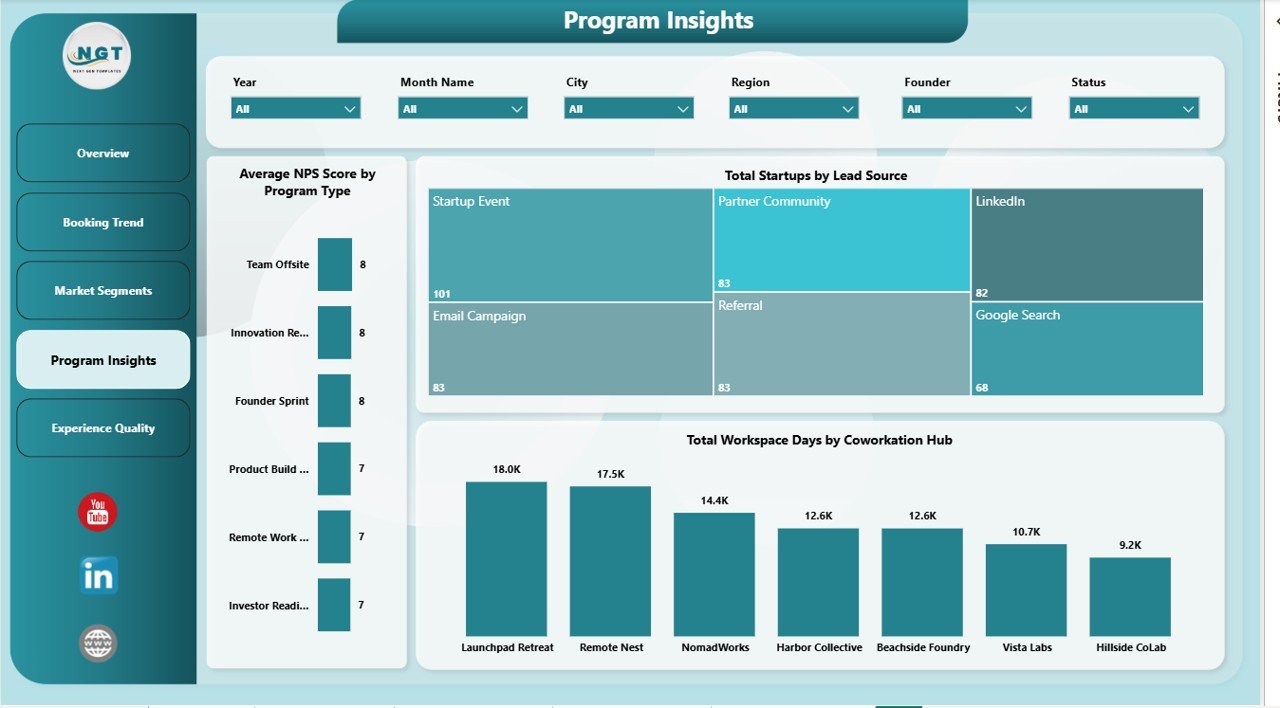
Page 4: Program Insights
The Program Insights page connects startup acquisition, hub usage, and satisfaction. Average NPS Score by Program Type shows which programs create the strongest participant experience. Total Startups by Lead Source identifies which acquisition channels bring the most startup participants. Total Workspace Days by Coworkation Hub compares hub-level usage, making this page useful for operational planning and partner discussions.
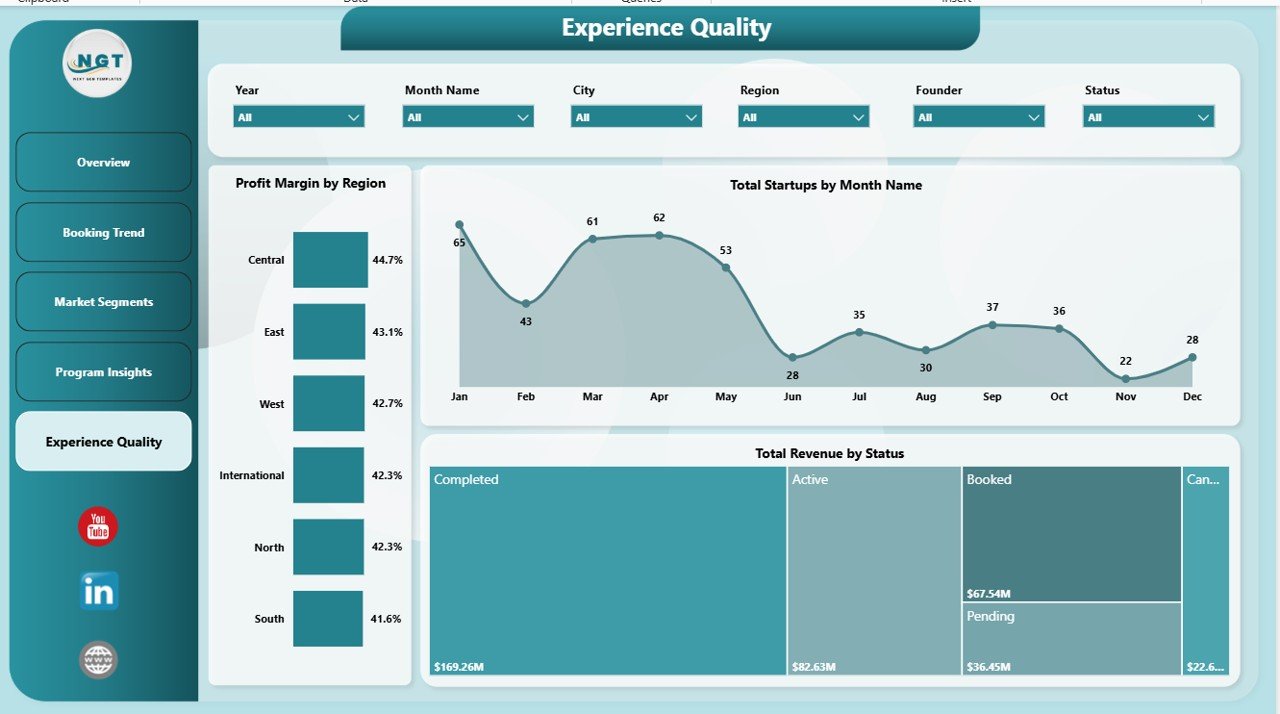
Page 5: Experience Quality
The Experience Quality page brings together margin, startup trend, and status-based revenue. Profit Margin by Region shows where the coworkation model is most financially efficient. Total Startups by Month Name highlights participation growth or seasonality. Total Revenue by Status shows how revenue is distributed across active, completed, or other operating states, helping teams understand the value of each program stage.
Coworkation Startups Dashboard in Power BI vs. Tableau vs. Paid CRM/SaaS – Feature Comparison
| Feature | Coworkation Startups Dashboard in Power BI | Tableau Alternative | Paid Coworking SaaS |
|---|---|---|---|
| Cost | $17.99 one-time | License or custom build cost | $50-$200+ per month |
| Platform | Power BI Desktop and Power BI Service | Tableau Desktop or Cloud | Vendor web app |
| Setup time | Under 10 minutes after data mapping | Depends on workbook setup | Days of onboarding |
| Real-time team collaboration | Via Power BI Service when published | Via Tableau Cloud | Usually included |
| Mobile access | Power BI mobile app after publishing | Tableau mobile app | Vendor app or browser |
| Customizable fields | Editable PBIX model and visuals | Editable with Tableau skills | Limited by plan |
| Year-1 cost at 5 users | $17.99 plus Microsoft licensing you already use | Can rise with licenses | $600-$2,400+ |
| Coworkation-specific KPIs | Included across all 5 pages | Requires custom setup | Depends on vendor reporting |
Who Should Use This Template
This dashboard is a strong fit for coworkation hub managers, coworking operators, accelerator teams, incubator program managers, startup ecosystem teams, venture studio operators, and analysts who already collect booking or program data and want a clean Power BI reporting layer.
It is not a full booking platform, CRM, billing tool, or automated member management system. If your team needs door access control, invoice automation, or real-time bookings, this dashboard should sit beside those tools as the analytics and presentation layer.
Real-World Use Cases
Riya manages a 3-hub coworkation network. She uses the Booking Trend and Experience Quality pages to compare workspace days, profit margin, and revenue status before deciding where to add new capacity.
Marco runs an accelerator program. He uses the Market Segments page to show investors how revenue differs by program type, funding stage, and industry.
Aisha leads partnerships for a coworking startup. She uses Program Insights to compare lead sources and NPS by program type before renewing partnerships with travel, coworking, and startup community partners.
Advantages of Coworkation Startups Dashboard in Power BI
- It gives a structured view of revenue, cost, gross profit, workspace days, startup activity, and NPS in one PBIX file.
- It is editable in Power BI Desktop, so analysts can adjust visuals and measures as business needs change.
- It supports better stakeholder presentations by separating analysis into five focused pages.
- It avoids recurring template subscription fees while still giving modern Power BI visuals and slicers.
- It works well for monthly reporting, investor updates, hub reviews, and internal planning meetings.
Opportunities for Improvement
- The template does not include live API sync with coworking systems such as Nexudus, Cobot, or OfficeRnD.
- Teams must keep source data clean and consistent for accurate slicers, measures, and charts.
- Publishing and secure sharing through Power BI Service may require Microsoft licensing beyond the PBIX file.
- Advanced customization requires some familiarity with Power Query, DAX, and Power BI relationships.
Best Practices
- Use consistent names for regions, coworkation hubs, program types, lead sources, and funding stages.
- Refresh the report on a weekly or monthly schedule so trend pages stay useful.
- Keep a backup copy before changing relationships, measures, or report page layouts.
- Use the Overview page for executive updates and the detailed pages for operational decisions.
- Validate revenue, cost, and workspace day fields before sharing dashboards with stakeholders.
Explore Relevant Templates
Coworkation Startups Dashboard in Excel – use this version if your team prefers workbook-based reporting.
Content Personalization Startups Dashboard in Power BI – useful for startup marketing and personalization analytics.
Career Mentorship Platforms Dashboard in Power BI – another Power BI dashboard for platform-based performance reporting.
Browse the full Power BI Dashboard Templates collection at NextGenTemplates.
Frequently Asked Questions
What KPIs does the Coworkation Startups Dashboard in Power BI track?
It tracks Workspace Utilization Rate, Total Workspace Days, Total Revenue, Total Cost, and Gross Profit at the KPI card level, with supporting visuals for startups, program type, region, industry, funding stage, lead source, hub, status, month, and quarter.
Do I need a paid Power BI license?
You can open and edit the PBIX file in Power BI Desktop, which is free. A Power BI Pro or Fabric license may be required if you want to publish and share the report through Power BI Service.
Can I connect my own data?
Yes. You can replace the sample records or connect your own Excel, CSV, database, SharePoint, or supported Power BI data source through Power Query.
Can I customize the charts and DAX measures?
Yes. The file is editable in Power BI Desktop, including visuals, colors, pages, model relationships, columns, and DAX measures.
Is this a booking management tool?
No. It is a reporting dashboard template. It does not create bookings, handle billing, or manage coworking access. Use it to analyze data from those systems.
Is there an Excel version available?
Yes. The Coworkation Startups Dashboard in Excel is available for teams that prefer pivot tables and spreadsheet reporting.
About the Author
Built by PK – Microsoft Certified Professional with 15+ years of Excel, Google Sheets, and Power BI experience. Founder of NextGenTemplates, reaching 300K+ subscribers across YouTube channels. Every template is hand-built and tested before release.
Conclusion
The Coworkation Startups Dashboard in Power BI gives startup ecosystem teams a focused reporting layer for revenue, gross profit, workspace utilization, booking trends, program segmentation, and experience quality. It is practical for hub managers who want better insight without building every report page from scratch.
Click here to download the Coworkation Startups Dashboard in Power BI
Visit our YouTube channel for step-by-step tutorials: Youtube.com/@PK-AnExcelExpert
Last updated: May 21, 2026