
Creative agencies run on fast-moving project data: service lines, campaign types, billable hours, retainers, delivery statuses, revision rounds, client ratings, acquisition channels, and agency-level profit. When those records are scattered across project tools, spreadsheets, and finance exports, leadership can see revenue but still miss the delivery and quality signals behind it. The Creative Agencies Dashboard in Power BI brings those agency metrics into one editable PBIX report with 5 report pages, 5 KPI cards, 15+ chart views, and multiple slicers. It is built for agency owners, account leads, operations managers, client service teams, and finance analysts who want clean reporting without starting from a blank Power BI canvas.
This template works in Power BI Desktop, which Microsoft provides for building and editing Power BI reports. You can replace the sample source with your own creative agency data, refresh the report, and use slicers to review revenue, projects, cost, profit, service mix, team performance, and client quality.
Key Features of Creative Agencies Dashboard in Power BI
- 5-page Power BI report: Overview, Project Trend, Service Mix, Agency Team, and Client Quality.
- 5 headline KPI cards: Total Revenue, Total Projects, Total Cost, Profit Margin, and Gross Profit.
- Multiple slicers: Filter the dashboard quickly by agency, time, service line, client industry, campaign type, retainer type, delivery status, region, and related fields.
- 15+ chart views: Analyze revenue, cost, projects, billable hours, gross profit, margin, client ratings, acquisition channels, and revision rounds.
- Editable PBIX file: Adjust visuals, measures, fields, relationships, colors, and data connections in Power BI Desktop.
- One-time template purchase: Useful for teams that want an analytics layer without another reporting subscription.
Dashboard Pages Explanation
The Creative Agencies Dashboard in Power BI is arranged into five focused pages. Each page answers a different agency management question, while slicers let users filter the report and review a narrowed view quickly.
1. Overview Page
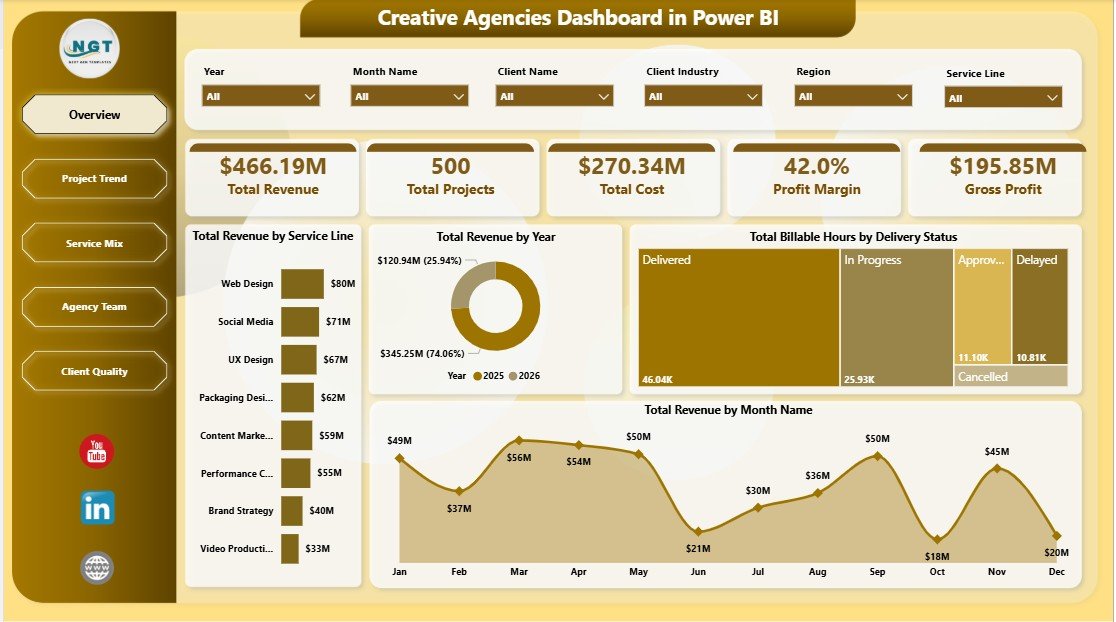
The Overview Page is the executive summary. At the top, cards show Total Revenue, Total Projects, Total Cost, Profit Margin, and Gross Profit. These KPIs help leaders understand commercial volume, workload, spend, margin, and profit before reviewing deeper visuals.
Total Revenue by Service Line: This chart compares revenue across creative services such as branding, paid media, design, content, production, and strategy. It helps owners see which services drive the strongest top-line contribution.
Total Revenue by Year: This chart shows annual revenue movement. Use it to review long-term growth and compare year-over-year direction during planning meetings.
Total Billable Hours by Delivery Status: This view connects effort with delivery progress. It helps operations teams see whether hours are sitting in completed, active, delayed, or pending work.
Total Revenue by Month Name: This monthly trend highlights seasonal patterns, campaign cycles, and months where stronger pipeline action may be needed.
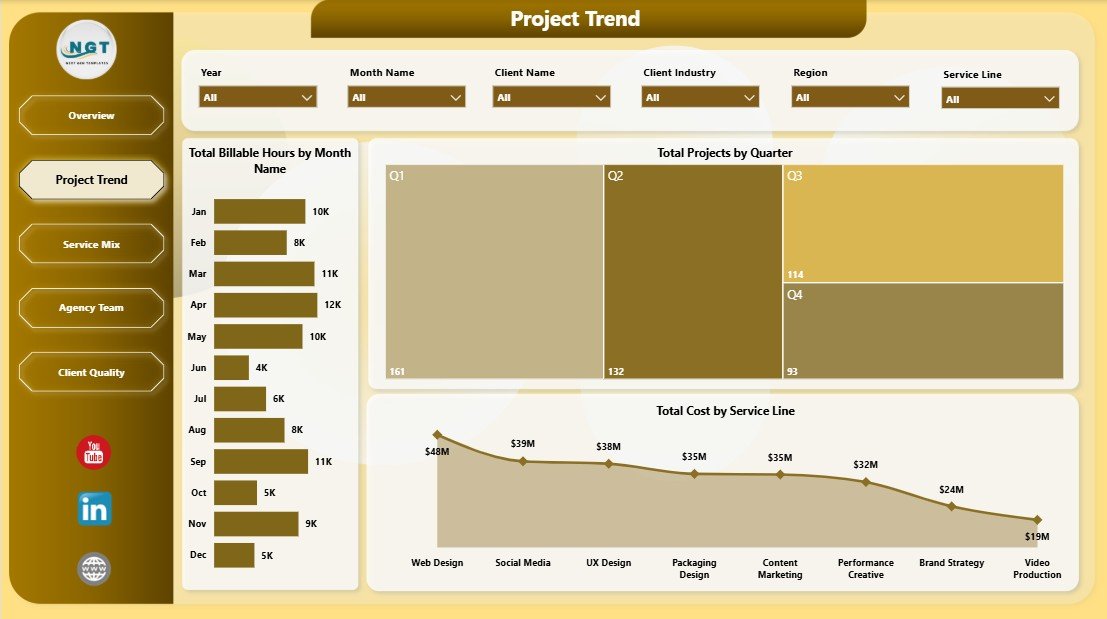
2. Project Trend
The Project Trend page focuses on workload and delivery movement. Total Billable Hours by Month Name shows when delivery pressure is rising or falling. Total Projects by Quarter helps leaders understand project volume by quarter. Total Cost by Service Line reveals which services consume the most delivery cost.
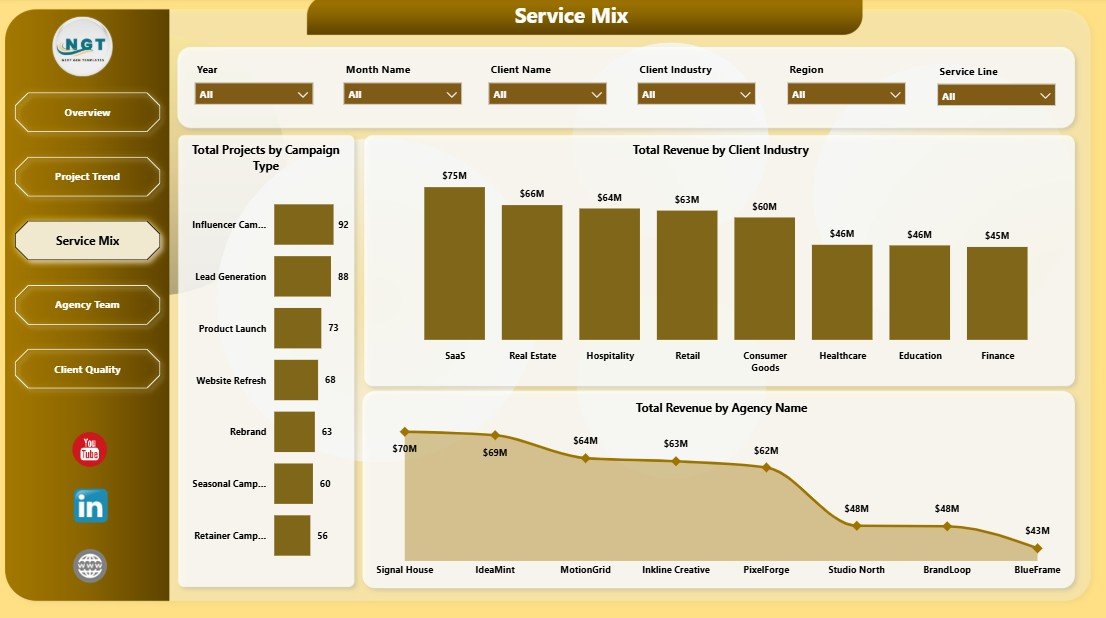
3. Service Mix
The Service Mix page explains what kind of work and client markets are driving performance. Total Projects by Campaign Type shows the agency project mix. Total Revenue by Client Industry identifies high-value sectors. Total Revenue by Agency Name compares revenue across agency units, locations, brands, or entities.
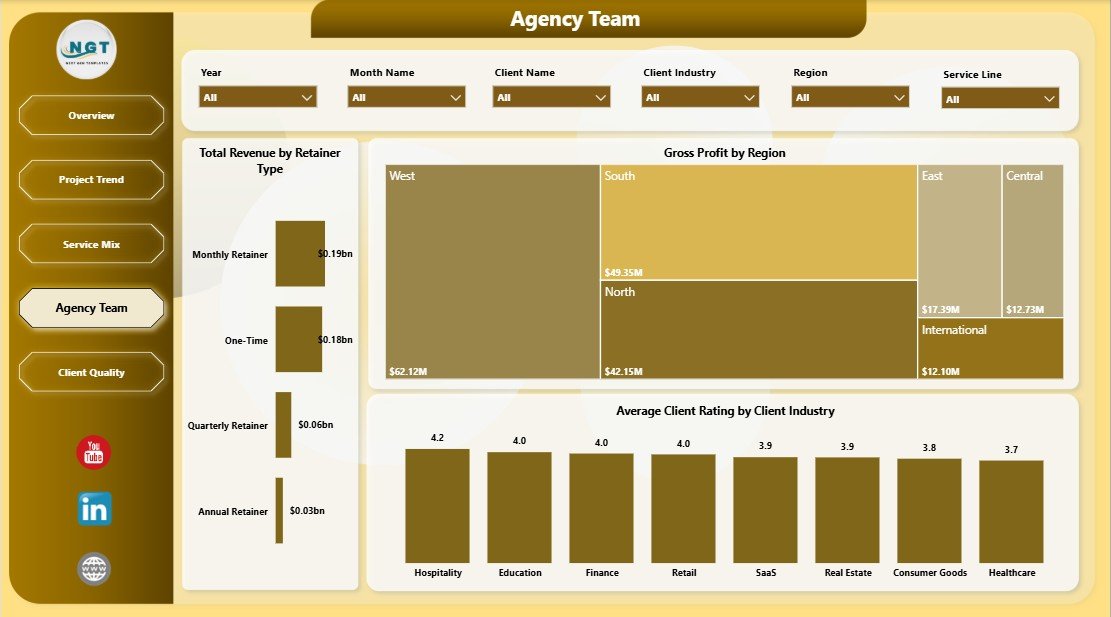
4. Agency Team
The Agency Team page connects retainer model, geography, profit, and client feedback. Total Revenue by Retainer Type compares recurring revenue with one-off or project-based work. Gross Profit by Region shows where margin is strongest. Average Client Rating by Client Industry helps teams review satisfaction by market segment.
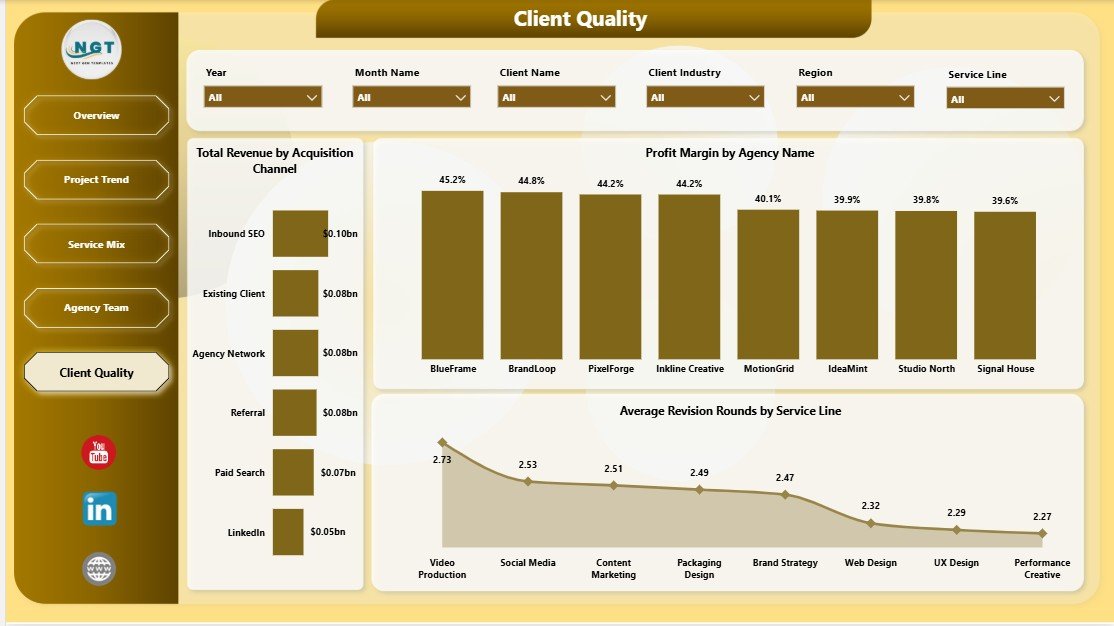
5. Client Quality
The Client Quality page is useful for acquisition and delivery improvement. Total Revenue by Acquisition Channel shows which channels bring higher-value clients. Profit Margin by Agency Name compares profitability across agency units. Average Revision Rounds by Service Line highlights services that may need clearer briefs, scope control, or better approval workflows.
Creative Agencies Dashboard in Power BI vs. Tableau vs. Paid CRM/SaaS – Feature Comparison
| Feature | Creative Agencies Dashboard in Power BI | Tableau or Qlik Alternative | Paid Agency SaaS |
|---|---|---|---|
| Cost | $17.99 one-time sale price | BI license plus build effort | Monthly or annual subscription |
| Platform | Power BI Desktop and Power BI Service | Tableau, Qlik, or another BI platform | Vendor cloud app |
| Setup time | Open PBIX, connect data, refresh | Requires report design and modeling | Requires onboarding and configuration |
| Real-time team collaboration | Available after publishing with the right Power BI license | Available through cloud/server setup | Usually included by paid seat |
| Mobile access | Available through Power BI mobile after publishing | Available in cloud/server plans | Usually included |
| Customizable fields | Editable model, visuals, pages, and measures | Editable with BI skills | Plan and permission dependent |
| Share with link | Available when published with proper permissions | Available in paid cloud/server plans | Usually login-based |
| Year-1 cost at 5 users | $17.99 plus existing Microsoft licensing | Often hundreds or thousands before build time | Can reach thousands per year |
| Best fit | Agency reporting and analytics review | Teams already standardized on another BI platform | Teams needing full CRM, billing, approvals, and task workflows |
Who Should Use This Template
- Creative agency founders reviewing revenue, profit, cost, and workload.
- Account leads comparing client quality, industries, campaign types, and retainers.
- Operations managers monitoring billable hours, delivery status, and project trends.
- Finance teams tracking cost, gross profit, and profit margin by agency or region.
- Digital marketing agencies that want Power BI reporting beside their project tools.
- Consulting-style service teams that manage retainers, service lines, and client satisfaction.
Real-World Use Cases
Agency founder: A founder opens the Overview page before the monthly leadership meeting to review total revenue, cost, profit margin, project volume, and gross profit in one place.
Operations manager: An operations manager uses Project Trend to see whether billable hours are building up in delayed or active work and whether one service line is driving too much cost.
Client services lead: A client services lead reviews Client Quality to compare acquisition channels, revision rounds, and margin patterns before updating scoping rules.
Advantages of Creative Agencies Dashboard in Power BI
- It saves report-building time compared with designing a Power BI agency dashboard from scratch.
- It gives teams a focused structure for revenue, cost, project, profit, and quality reporting.
- It supports interactive filtering through slicers and Power BI cross-filtering behavior.
- It is editable, so advanced users can customize fields, measures, visuals, colors, and pages.
- It helps agency teams connect commercial performance with delivery effort and client quality.
Opportunities for Improvement
This dashboard is an analytics template, not an agency management platform. It does not create invoices, track live tasks, run approval workflows, capture time entries automatically, or manage client portals. It also depends on clean input data. For best results, keep service line, campaign type, client industry, retainer type, delivery status, acquisition channel, and agency names consistent.
Best Practices
- Keep one clean source table for agency project records.
- Standardize service line, campaign type, client industry, status, and retainer names.
- Refresh the report after every data update.
- Start with the Overview page, then move into Project Trend, Service Mix, Agency Team, and Client Quality.
- Use slicers during review meetings to isolate one agency, service line, industry, campaign type, or month.
- Keep a backup copy before changing the PBIX model, relationships, or measures.
Explore Relevant Templates
- Creative Agencies Dashboard in Power BI – download the Power BI dashboard template.
- Creative Agencies Dashboard in Excel – workbook version for spreadsheet-first agency teams.
- Content Personalization Startups Dashboard in Power BI – marketing analytics dashboard for personalization and startup campaigns.
- Concert Promoters Dashboard in Power BI – event marketing and revenue performance dashboard.
- Browse Power BI Dashboard templates.
Frequently Asked Questions
What is the Creative Agencies Dashboard in Power BI?
It is an editable PBIX dashboard template for creative agency reporting, including revenue, projects, cost, profit margin, gross profit, billable hours, service mix, agency team performance, and client quality.
How many pages are included?
The dashboard includes five report pages: Overview, Project Trend, Service Mix, Agency Team, and Client Quality.
Do I need Power BI Pro?
No. You can open and edit the file in Power BI Desktop. Power BI Pro is only needed if you want to publish and share the report through Power BI Service.
Can I replace the sample data?
Yes. Replace or connect the source data with your own agency records, then refresh the report.
Can I customize visuals and measures?
Yes. You can customize pages, visuals, fields, labels, colors, relationships, and measures in Power BI Desktop.
Does this dashboard replace agency software?
No. It is a reporting dashboard. Use it alongside your CRM, project management tool, invoicing system, or time tracking workflow.
About the Author
Built by PK – Microsoft Certified Professional with 15+ years of Excel, Google Sheets, and Power BI experience. Founder of NextGenTemplates, reaching 300K+ subscribers across YouTube channels. Every template is hand-built and tested before release.
Conclusion
The Creative Agencies Dashboard in Power BI gives agencies a clean way to review revenue, projects, cost, profit margin, gross profit, billable hours, service mix, agency team results, and client quality. Instead of rebuilding charts manually, users can open the PBIX file, connect their data, refresh the report, and use the five pages for management review.
Click here to download the Creative Agencies Dashboard in Power BI
For more Power BI and Excel dashboard tutorials, visit YouTube.com/@PKAnExcelExpert.
Last updated: May 22, 2026.