If you manage transportation, freight, fleet, or shipping operations, you already know the pain: data scattered across a dozen spreadsheets, no single view of carrier performance, and rising costs that are hard to pin down. The Logistics and Transportation Hub fixes this by giving you 7 premium logistics dashboard templates for Excel and Power BI in one affordable bundle — everything from carrier and route analysis to freight cost tracking, fleet utilization, and MTD/YTD shipping KPIs.
Purchased separately, these 7 templates cost $110.93. As a bundle, you pay just $69.99 — a 37% discount and $40.94 in savings. Browse the full Logistics & Transportation collection or grab the complete pack below.
🚀 Logistics and Transportation Hub — 7 Templates for $69.99
$110.93 $69.99 Save 37%
🔑 Key Features of the Logistics and Transportation Hub
This bundle was assembled to cover the entire logistics lifecycle — not just one slice of it. Whether you need a quick offline Excel report or an interactive Power BI dashboard for your leadership team, the Hub has you covered.
End-to-end coverage: Transportation operations, freight cost control, fleet management, and shipping performance all live in one toolkit, so you are never jumping between unrelated files.
Dual platform power: You get both Excel and Power BI versions of the flagship transportation dashboard, plus five additional Excel dashboards — ideal for teams that mix offline reporting with modern BI.
Carrier and route optimization: Compare carrier costs and delivery times, surface inefficient routes, and renegotiate contracts with hard data instead of guesswork.
Freight cost and spend tracking: Monitor total freight cost, cost per shipment, fuel surcharges, and freight spend broken down by region, carrier, and shipment type.
Fleet utilization and maintenance: Track vehicle performance, mileage, fuel efficiency, maintenance schedules, and total fleet cost versus budget to cut downtime and waste.
MTD and YTD shipping KPIs: Measure actual vs target performance, on-time delivery rates, and previous-year comparisons with intuitive variance arrows.
Interactive and beginner-friendly: Every template uses slicers, PivotTables, and auto-updating charts — no macros, no coding, and no expensive BI licences required for the Excel files.
📦 What’s Included in the Bundle
1. Transportation & Logistics Dashboard in Excel
Five analytical pages — Overview, Carrier Performance, Route Analysis, Product Shipment, and Time-Based Analysis — with slicers and KPI cards for total shipments, cost, and on-time percentage. Perfect for executive reviews and operations meetings.
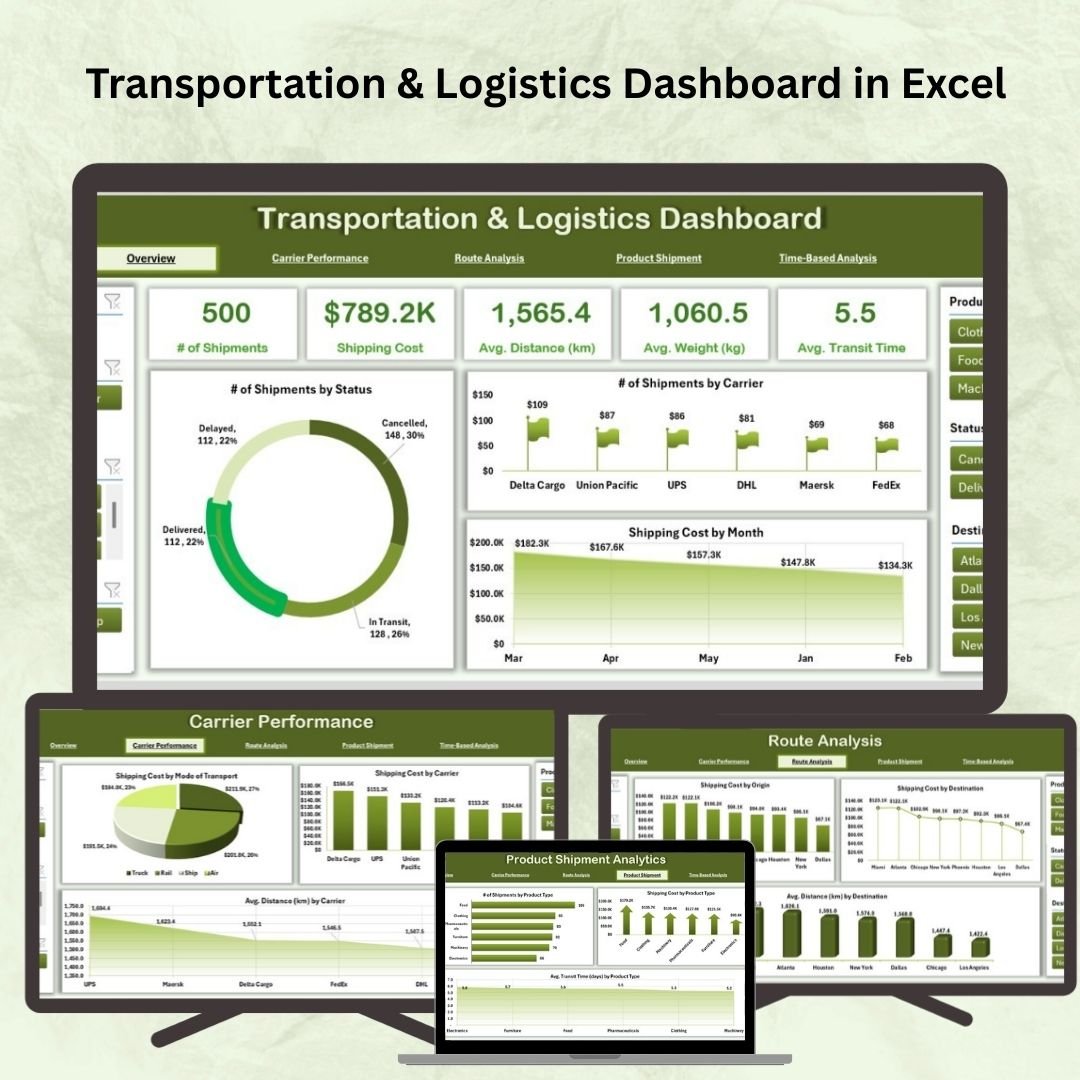
Transportation & Logistics Dashboard in Excel
👉 View the Transportation & Logistics Dashboard in Excel
2. Transportation & Logistics Dashboard in Power BI
The same logistics analytics rebuilt in Power BI with five interactive pages and eight slicers per page. Connect your Excel, SQL, or cloud data and get fast, polished visuals for carrier, route, product, and time-based analysis.
 Transportation & Logistics Dashboard in Power BI
👉 View the Transportation & Logistics Dashboard in Power BI
3. Transportation Dashboard in Excel
Region, vehicle, and route analysis with fuel cost budget tracking and monthly trend monitoring across five pages plus a data sheet. Ideal for fleet operators comparing actual vs budgeted fuel costs.
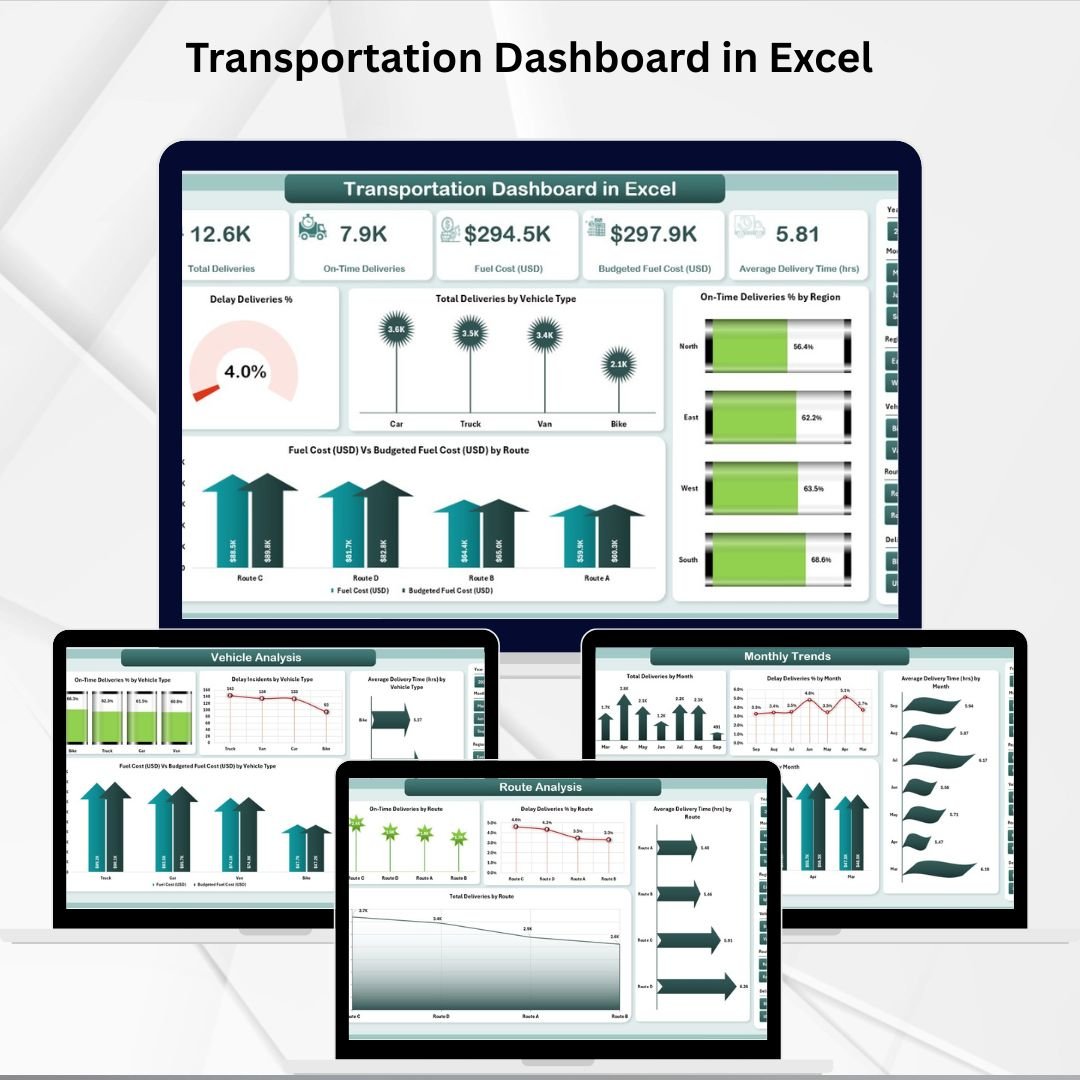 Transportation Dashboard in Excel
👉 View the Transportation Dashboard in Excel
4. Freight Cost KPI Dashboard in Excel
Track total freight cost, cost per shipment, delivery time, and carrier comparison, with a clear freight spend breakdown by region and shipment type. A must-have for controlling shipping expenses.
 Freight Cost KPI Dashboard in Excel
👉 View the Freight Cost KPI Dashboard in Excel
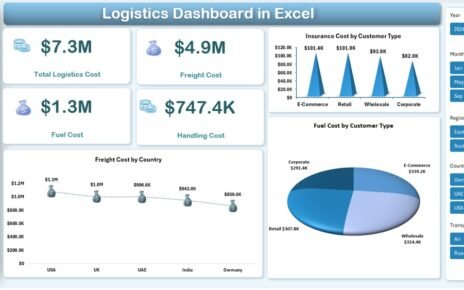
5. Shipping Dashboard in Excel
Five analytical pages tracking freight cost, profit, in-transit percentage, and cost-vs-revenue by department, region, and mode of transport — with a page navigator and dynamic slicers for fast drill-down.
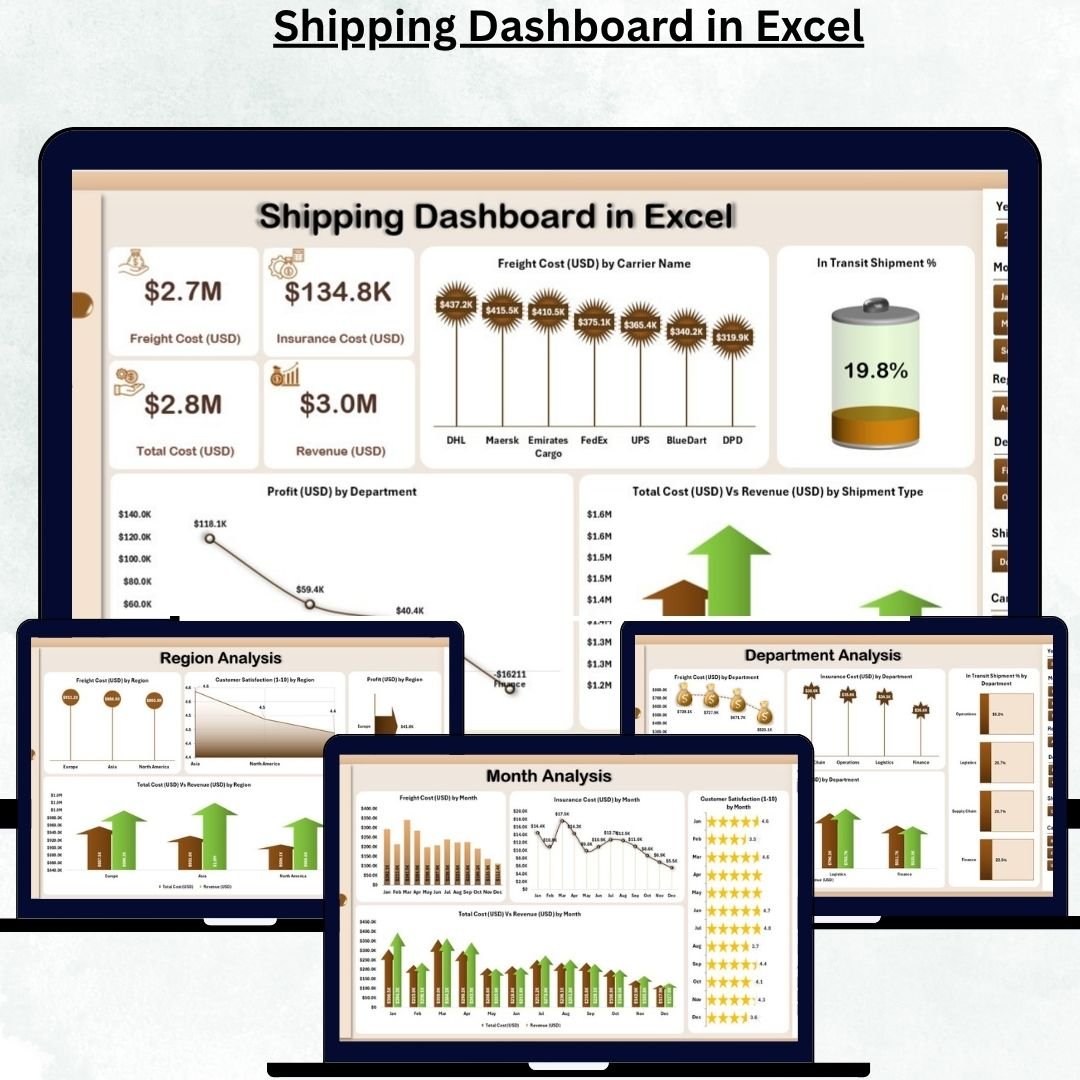 Shipping Dashboard in Excel
👉 View the Shipping Dashboard in Excel
6. Fleet Management KPI Dashboard in Excel
Monitor vehicle performance, fuel efficiency, maintenance schedules, utilization rates, and total fleet cost against budget — the perfect companion for fleet managers focused on uptime and cost control.
 Fleet Management KPI Dashboard in Excel
👉 View the Fleet Management KPI Dashboard in Excel
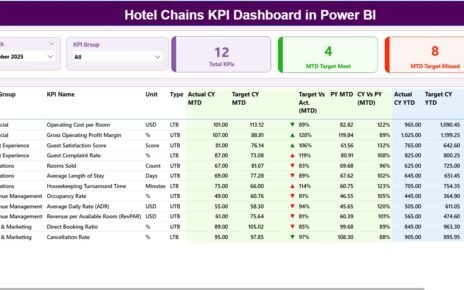
7. Shipping KPI Dashboard in Excel
An MTD & YTD performance system with actual vs target, previous-year comparison, KPI trend charts, and a full KPI definition library — great for freight forwarders and supply chain analysts who report monthly.
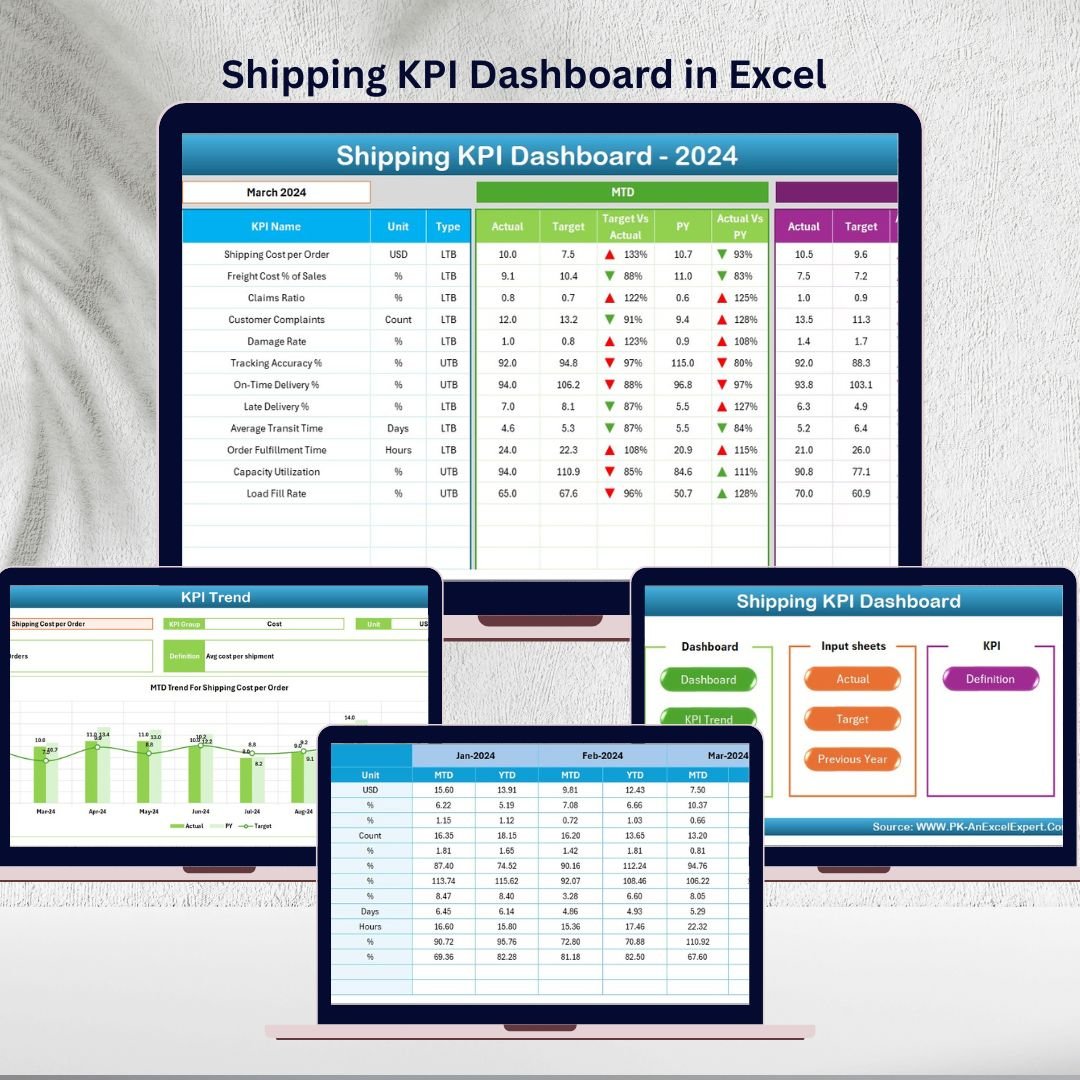 Shipping KPI Dashboard in Excel
👉 View the Shipping KPI Dashboard in Excel
💡 Smart Comparison — Individual vs Bundle
| # | Template | Platform | Individual Price |
|---|---|---|---|
| 1 | Transportation & Logistics Dashboard | Excel | $17.99 |
| 2 | Transportation & Logistics Dashboard | Power BI | $17.99 |
| 3 | Transportation Dashboard | Excel | $17.99 |
| 4 | Freight Cost KPI Dashboard | Excel | $12.99 |
| 5 | Shipping Dashboard | Excel | $17.99 |
| 6 | Fleet Management KPI Dashboard | Excel | $12.99 |
| 7 | Shipping KPI Dashboard | Excel | $12.99 |
| Total Individual Value | $110.93 | ||
| Bundle Price (Save 37%) | $69.99 | ||
✅ Advantages of Buying the Bundle
Immediate savings: You keep $40.94 in your pocket versus buying each dashboard one at a time — the equivalent of getting more than three templates free.
One consistent toolkit: All seven dashboards share the same clean, slicer-driven design language, so your team only learns one workflow and your reports look consistent across departments.
Coverage with no gaps: Instead of realizing mid-project that you are missing a freight-cost or fleet view, you have the complete logistics picture from day one.
Excel and Power BI flexibility: Use Excel offline for quick analysis and Power BI when you need shareable, interactive reports for stakeholders.
🎯 Best Practices for Deploying the Hub
Standardize your data first. Before importing, make sure your shipment, carrier, fleet, and cost data use consistent column headers and date formats — this makes every template plug-and-play.
Start with the Overview pages. Use the high-level dashboards for monthly leadership reviews, then drill into carrier, route, fleet, or freight detail when something needs attention.
Set targets early. The Shipping KPI Dashboard works best when you populate the Target and Previous Year sheets, unlocking meaningful variance analysis.
Refresh on a schedule. Update your data weekly or monthly and hit Refresh All so KPIs, slicers, and charts always reflect current performance.
📚 Explore More Templates
Looking for more? Browse these popular NextGenTemplates collections:
- 🚛 Logistics & Transportation Templates
- 📊 Excel Dashboard Templates
- 📈 Power BI Dashboard Templates
- 🧾 KPI Dashboard Templates
💡 Tip: Use coupon code WELCOME15 for 15% off your first order.
❓ Frequently Asked Questions
1. What exactly is included in the Logistics and Transportation Hub?
You get 7 premium dashboard templates: two Transportation & Logistics dashboards (Excel and Power BI), a Transportation Dashboard, a Freight Cost KPI Dashboard, a Shipping Dashboard, a Fleet Management KPI Dashboard, and a Shipping KPI Dashboard — all delivered as downloadable files.
2. How much do I save with the bundle?
Bought individually the templates total $110.93. The bundle is $69.99, so you save $40.94, a 37% discount.
3. Which platforms do I need?
Six templates run in Microsoft Excel (no macros required) and one is a Power BI report file. You do not need any special add-ons for the Excel dashboards.
4. Do I need coding or technical skills?
No. Every dashboard is built with PivotTables, formulas, slicers, and charts. You simply replace the sample data with your own and refresh.
5. Can I customize the dashboards?
Yes. You can add or remove KPIs, adjust charts, and adapt the layouts to your organization’s needs.
6. Is this a one-time purchase?
Yes. You pay once and download the files — no subscription.
🏁 Conclusion
The Logistics and Transportation Hub gives logistics, fleet, and transportation managers a complete, affordable analytics toolkit — seven battle-tested Excel and Power BI dashboards covering carriers, routes, freight cost, fleet, and shipping performance. At $69.99 for the full pack (37% off), it is the fastest way to turn raw logistics data into decisions that cut cost and improve on-time delivery.
🚀 Ready to Streamline Your Logistics?
Get all 7 templates — $110.93 $69.99
About the Author: PK is a Microsoft Certified Professional with 15+ years of experience building Excel, Power BI, and Google Sheets dashboards, and the creator behind a YouTube community of 300,000+ subscribers. 🎥 Visit the PK: An Excel Expert YouTube channel for step-by-step video tutorials.