Defense Equipment Manufacturing Dashboard in Excel gives defense manufacturing teams a ready-to-use reporting workbook for tracking revenue, cost, production output, defects, quality score, downtime, lead time, contract performance, and plant-level operations. Manufacturing leaders often need weekly or monthly visibility across production, quality, finance, and customer commitments, but many teams still depend on manually built spreadsheet reports. This Excel dashboard reduces that reporting effort by organizing the most important metrics into 5 analysis pages, 5 executive KPI cards, 20+ charts, slicers, a structured Data Sheet, and a hidden Support Sheet powered by pivot tables.
The workbook is designed for teams that want a practical Excel reporting layer without committing to a large software implementation. You can replace the sample data, keep the same column structure, click Refresh All, and review updated dashboard pages immediately.
Download the Defense Equipment Manufacturing Dashboard in Excel from NextGenTemplates.
Defense Equipment Manufacturing Dashboard in Excel
Key Features of Defense Equipment Manufacturing Dashboard in Excel
The dashboard includes 5 main report pages: Overview, Production Trend, Quality Analysis, Customer Analysis, and Operations. Each page focuses on a different decision area, so managers can review financial performance, production movement, quality outcomes, customer and contract patterns, and operational execution without switching between separate files.
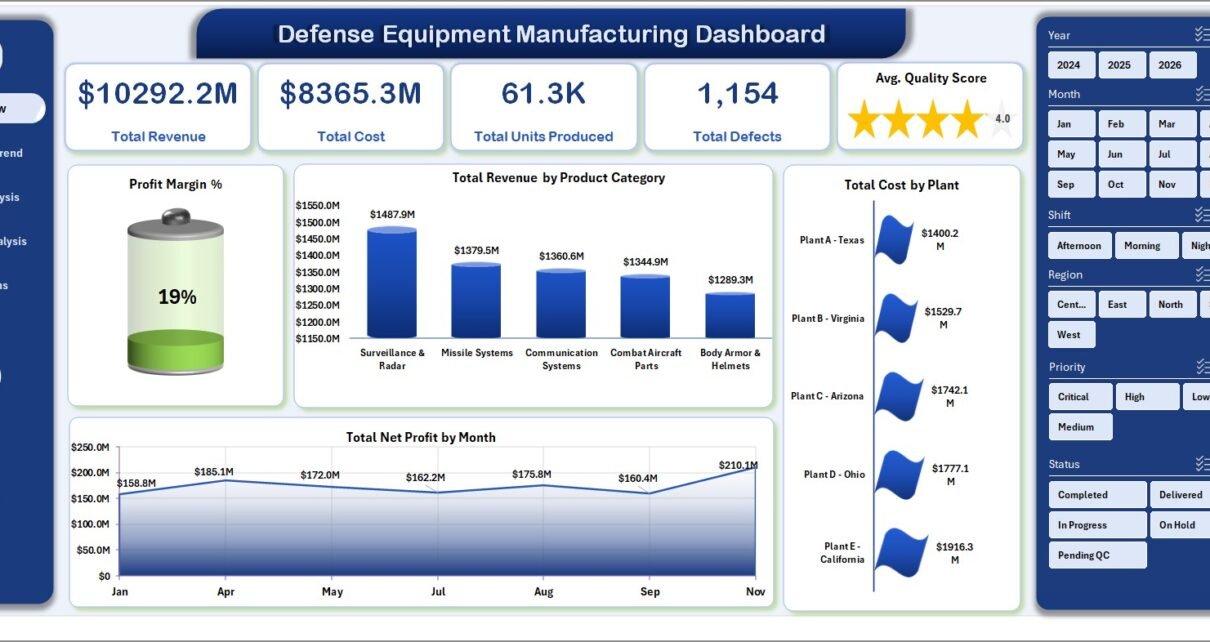
The Overview page includes 5 KPI cards: Total Revenue, Total Cost, Total Units Produced, Total Defects, and Avg. Quality Score. These cards give leadership a fast snapshot before moving into deeper analysis.
Multiple slicers make the dashboard easier to use during meetings. Instead of editing formulas or rebuilding reports, users can filter by dimensions such as plant, product category, contract type, region, priority, shift, status, quarter, month, or year depending on the available data fields.
The workbook also includes a Data Sheet and Support Sheet. The Data Sheet is where you add records in the required format. The Support Sheet stores pivot tables that feed charts and KPIs. After updating the Data Sheet, use Excel’s Refresh All command to update the dashboard. Microsoft also provides guidance on creating and using PivotTables for worksheet analysis here: Microsoft Support – Create a PivotTable.
Dashboard Pages Explanation
1. Overview Page
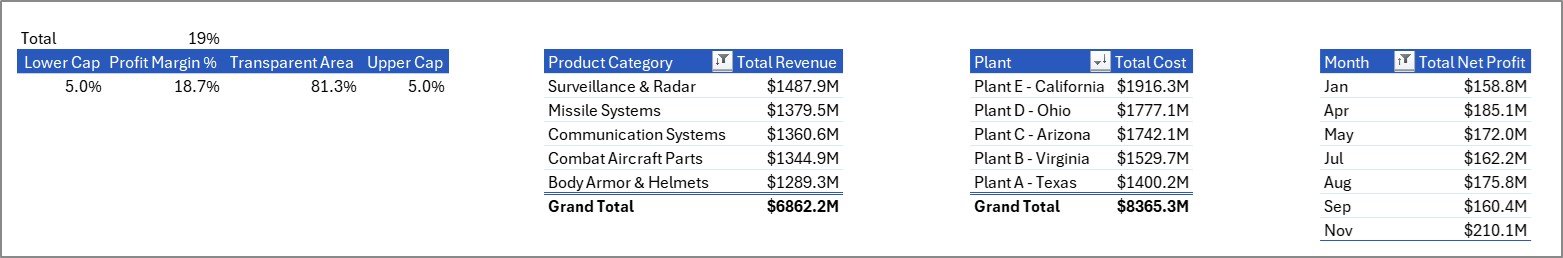
The Overview page shows the high-level cards and the first set of charts for leadership review. Cards include Total Revenue, Total Cost, Total Units Produced, Total Defects, and Avg. Quality Score.
Profit Margin % shows whether manufacturing activity is generating healthy margin after cost. It is useful for spotting cost pressure and understanding whether revenue growth is translating into profit.
Total Revenue by Product Category compares revenue across defense equipment categories. This helps leaders see which product groups contribute the most commercial value.
Total Cost by Plant compares cost across production locations. Plant managers can use this view to identify high-cost sites and investigate process, staffing, supplier, or volume-related causes.
Total Net Profit by Month tracks profitability across the year. It supports monthly reviews, trend analysis, and planning for future production cycles.
Overview Page
2. Production Trend
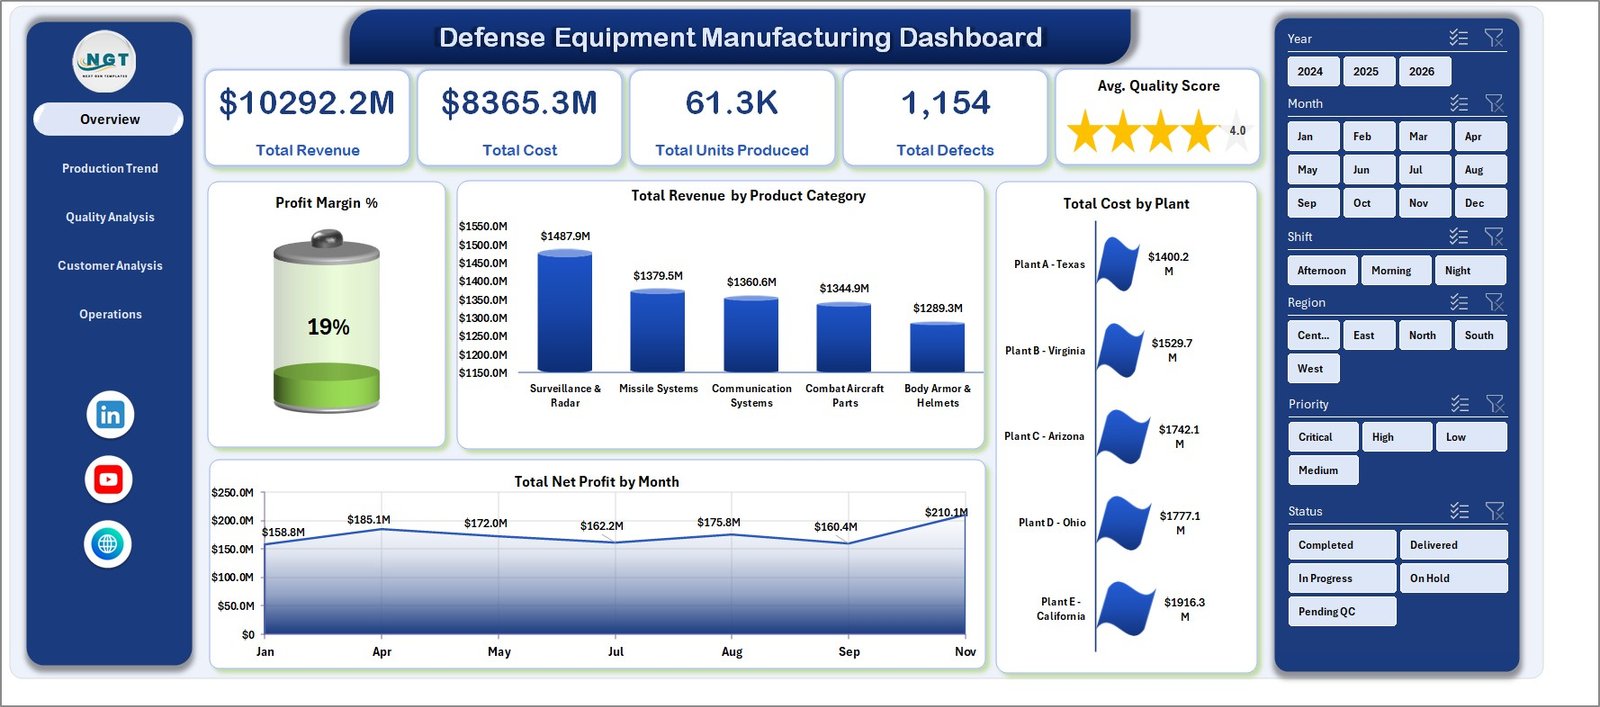
The Production Trend page focuses on cost, defects, defect rate, and production output. It is useful for production managers who need to understand how manufacturing performance changes across time, shifts, and product categories.
Total Cost by Quarter shows quarterly cost movement. This helps finance and operations teams understand whether cost increases are seasonal, volume-driven, or linked to specific production periods.
Total Defects by Shift compares defect counts across shifts. If one shift consistently shows more defects, managers can investigate training, workload, staffing, supervision, or process adherence.
Defect Rate % by Product Category highlights product categories that may require quality improvement. It is especially helpful when defect counts alone are misleading because production volume differs by category.
Total Units Produced by Year summarizes annual production output. It helps leadership review capacity growth, production consistency, and long-term output trends.
Production Trend
3. Quality Analysis
The Quality Analysis page connects quality performance with profitability, revenue, and product cost. It helps quality and operations teams avoid reviewing quality metrics in isolation.
Avg. Quality Score by Plant compares quality outcomes by production location. It helps managers identify plants that may need additional audits, training, or process improvement.
Total Net Profit by Shift shows profitability by shift. This can highlight whether certain operating periods produce better financial outcomes.
Total Revenue by Customer Type compares revenue contribution across customer groups. It supports contract segmentation and customer mix analysis.
Total Cost by Product identifies which products carry the highest cost. This view is useful for cost engineering, pricing review, and production planning.
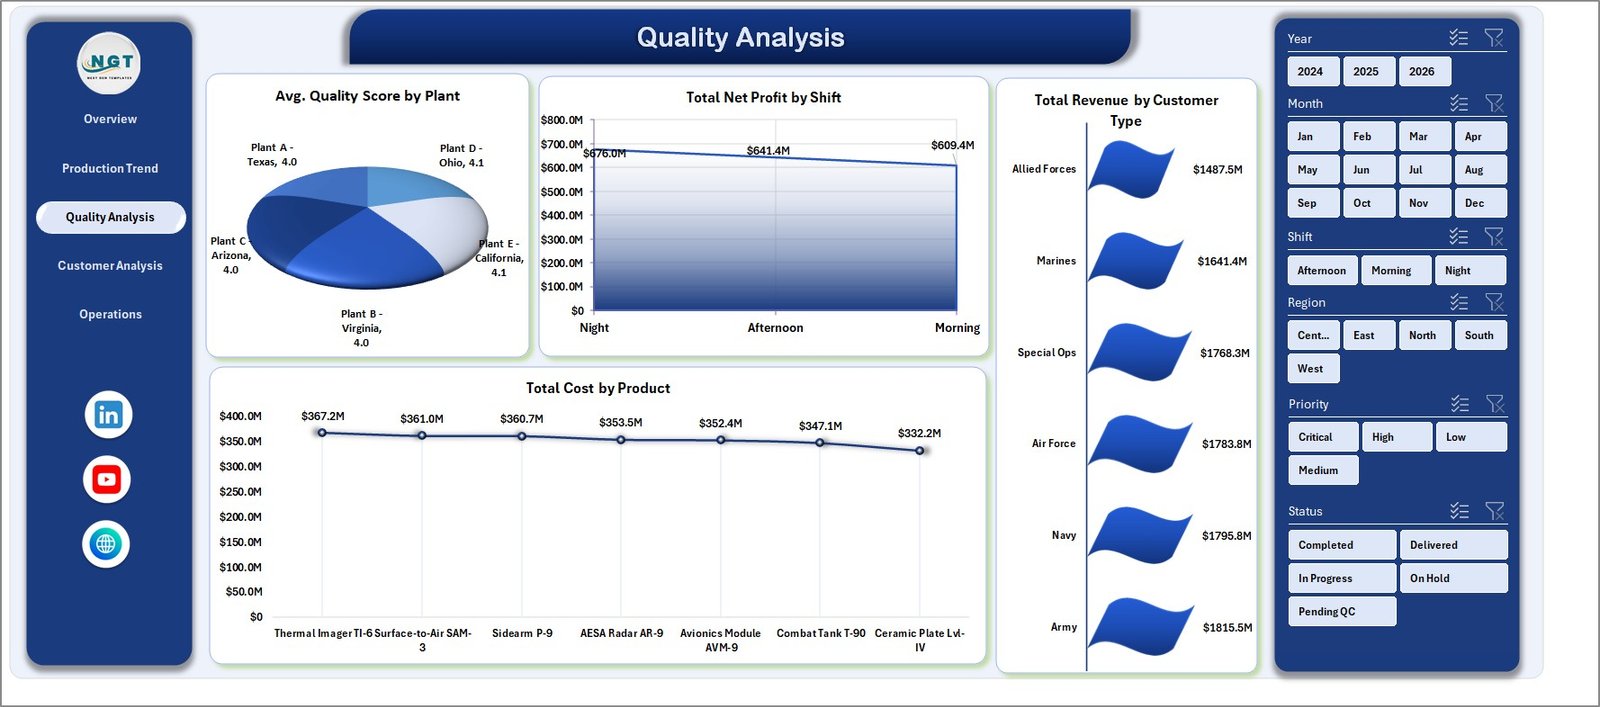
Quality Analysis
4. Customer Analysis
The Customer Analysis page brings together regional cost, contract type profitability, downtime, and priority-based revenue. It is helpful for program managers, customer account teams, and finance analysts.
Total Cost by Region shows how cost is distributed geographically. This can uncover regional cost differences linked to suppliers, logistics, labor, or plant activity.
Total Net Profit by Contract Type helps compare profitability across contract models. This can support pricing decisions and contract portfolio reviews.
Total Downtime Hours by Plant highlights production locations with higher downtime. It gives operations teams a clear starting point for maintenance and capacity discussions.
Total Revenue by Priority shows revenue by priority level. This helps teams understand how urgent or high-priority work contributes to overall business value.
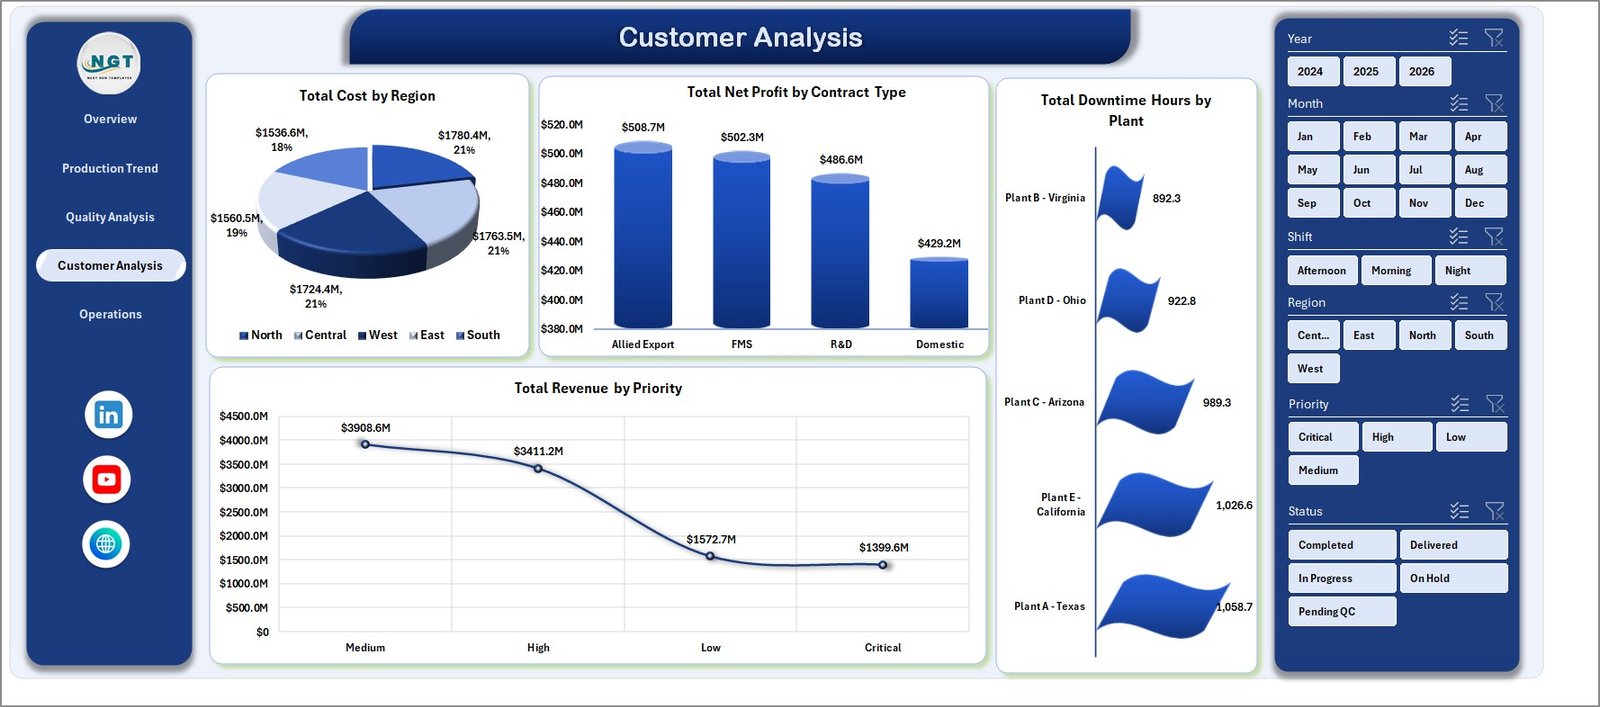
Customer Analysis
5. Operations
The Operations page is built for practical day-to-day review. It focuses on lead time, record status, profit by category, and revenue by plant.
Avg. Lead Time by Shift compares how long work takes across shifts. This can reveal workload imbalance or process delays.
Total Records by Status shows how many records sit in each status. It is useful for tracking pending, completed, delayed, or other operational states.
Total Net Profit by Product Category compares profitability by product category. It helps managers see which categories are commercially strongest after cost.
Total Revenue by Plant shows which plants contribute the most revenue. This is useful for site performance reviews and capacity planning.
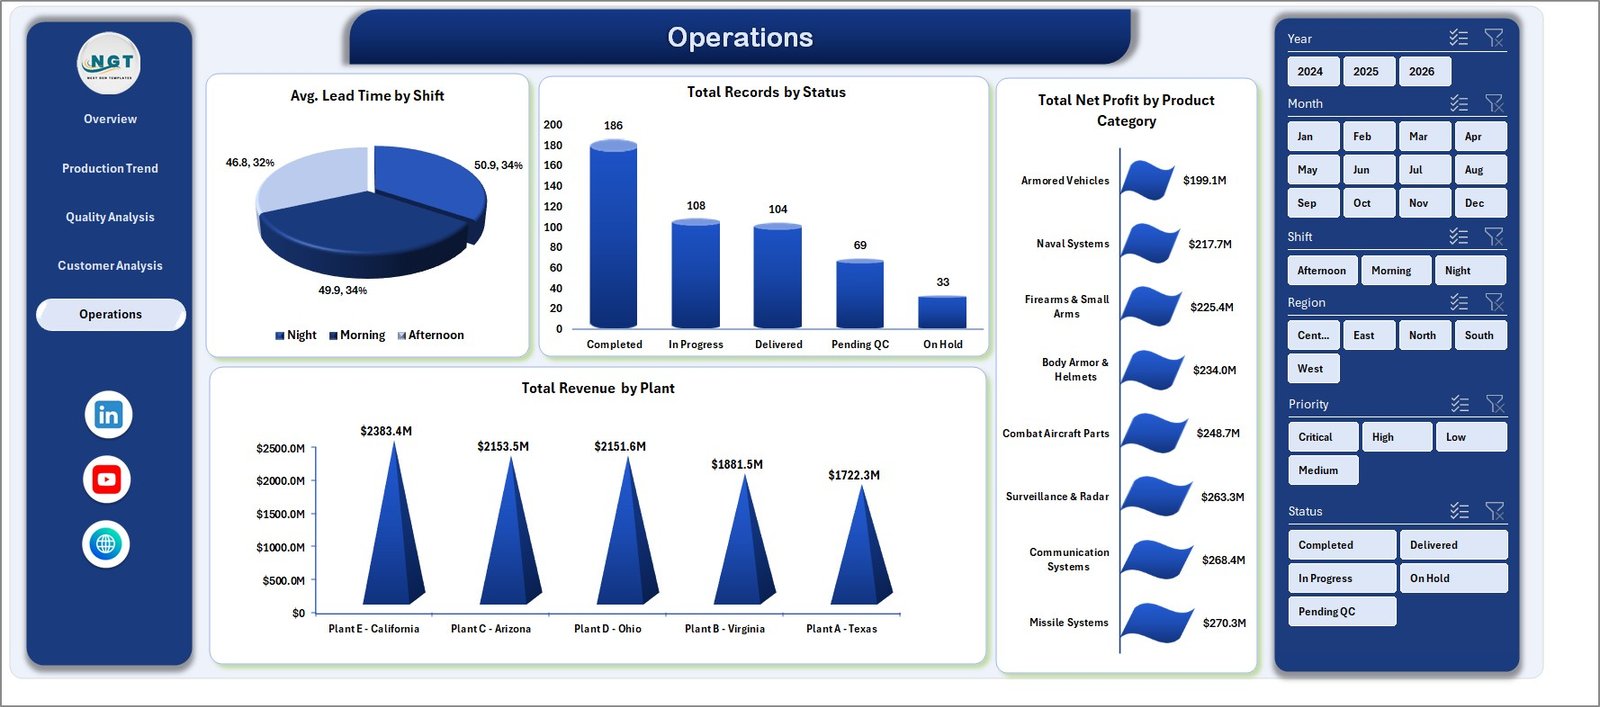
Operations
6. Data Sheet Tab
The Data Sheet is the input area for your records. Add your data in the same format, keep the column structure consistent, and then refresh the workbook.
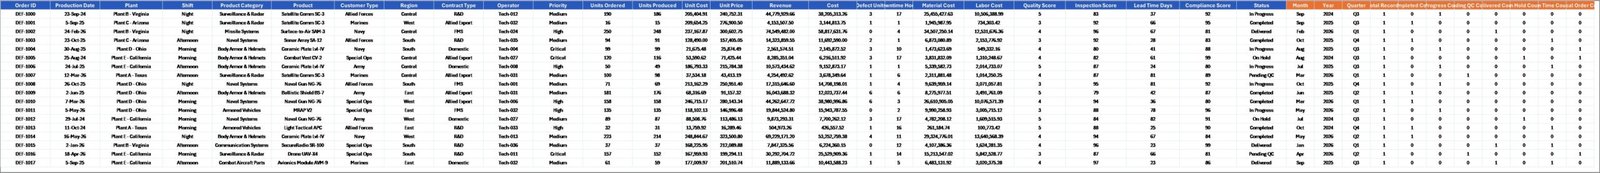
Data Sheet tab
7. Support Sheet
The Support Sheet contains the pivot tables used to power the dashboard dynamically. You can keep it hidden after setup. When data changes, go to the Data tab in Excel and click Refresh All so pivots, charts, and KPIs update together.
Support sheet tab
Defense Equipment Manufacturing Dashboard in Excel vs. Google Sheets vs. Paid Manufacturing SaaS – Feature Comparison
| Feature | This Excel Dashboard | Google Sheets Alternative | Paid Manufacturing SaaS |
|---|---|---|---|
| Cost | $17.99 one-time | Low cost, online dependent | Monthly or annual subscription |
| Platform | Microsoft Excel | Browser-based spreadsheet | Cloud application |
| Setup time | Update data and refresh | Copy file and adjust formulas | Implementation and configuration |
| Real-time collaboration | Available through OneDrive or SharePoint | Native browser collaboration | Usually included |
| Mobile access | Possible through Excel mobile or cloud storage | Good with Google account | Usually included |
| Customizable fields | Fully editable workbook | Editable sheet | Limited by vendor settings |
| Share with link | Possible through OneDrive or SharePoint | Native sharing | Vendor controlled |
| Year-1 cost at 5 users | $17.99 total | Usually low | Often hundreds or thousands of dollars |
| Pivot-driven refresh | Yes | Requires formulas or pivot setup | Depends on vendor |
| Offline use | Yes | Limited | No |
Who Should Use This Template
This dashboard is suitable for defense equipment manufacturers, defense suppliers, aerospace and defense operations teams, quality managers, plant leaders, production planners, contract analysts, and finance teams. It works best when your team already has production records in Excel, CSV, ERP exports, or another structured data source and needs a repeatable reporting workbook.
It is not a substitute for secure classified systems, ERP, MES, PLM, supplier compliance platforms, or real-time machine monitoring tools. If your organization works with controlled or sensitive data, use only records that your policies allow in Excel.
Real-World Use Cases
Plant Manager: A plant manager reviews Total Cost by Plant, Total Units Produced by Year, and Avg. Lead Time by Shift before the weekly production meeting. The dashboard helps identify capacity pressure and cost movement quickly.
Quality Lead: A quality lead uses Total Defects by Shift, Defect Rate % by Product Category, and Avg. Quality Score by Plant to prioritize corrective actions and training.
Contract Analyst: A contract analyst reviews Total Net Profit by Contract Type, Total Revenue by Customer Type, and Total Revenue by Priority before internal program reviews.
Advantages of Defense Equipment Manufacturing Dashboard in Excel
The main advantage is speed. You do not need to build charts, slicers, pivot tables, and KPI cards from a blank workbook. The structure is already prepared, so your team can focus on replacing sample data and reviewing the result.
The second advantage is ownership. Because the file is an Excel workbook, you can edit formulas, change chart titles, rename fields, add columns, change colors, and adapt the dashboard to your internal language.
The third advantage is cost control. A one-time Excel template is not the same as an enterprise analytics system, but for many reporting needs it is enough to create consistent management visibility without adding a subscription.
Opportunities for Improvement
For larger teams, the dashboard can be improved by connecting the Data Sheet to a controlled export process from ERP, MES, or approved data systems. This reduces manual copy-paste work and improves reporting discipline.
Teams can also add additional fields for supplier, product family, program name, production line, inspection type, or compliance status if those fields are part of their process. For the best results, add fields carefully and update pivots after changes.
Best Practices
Keep the Data Sheet structure clean. Avoid merged cells, blank header names, inconsistent dates, and mixed number formats. A structured table gives pivot tables cleaner source data.
Refresh the workbook after every data update. In Excel, go to the Data tab and click Refresh All so the pivot tables and dashboard visuals rebuild together.
Keep the Support Sheet hidden for end users. This reduces accidental edits while preserving the pivot logic behind the dashboard.
Review the dashboard with a consistent cadence. Weekly production reviews, monthly quality reviews, and quarterly contract reviews are natural places to use this workbook.
Explore Relevant Templates
You may also like the Manufacturing Excellence Bundle, Cryogenics Dashboard in Excel, Manufacturing Production Variance Analysis Dashboard in Excel, and Quality Assurance Dashboard in Excel.
You can browse more Excel Dashboard Templates and Manufacturing Excel Templates on NextGenTemplates.
Frequently Asked Questions
What does the Defense Equipment Manufacturing Dashboard in Excel track?
It tracks revenue, cost, units produced, defects, quality score, profit margin, net profit, downtime, lead time, plant performance, shift performance, product category performance, contract type, region, priority, and status.
Does the dashboard require macros?
No. It is designed around Excel tables, pivot tables, slicers, and charts.
How do I update the dashboard?
Replace the sample data in the Data Sheet, keep the same structure, and click Refresh All from the Data tab in Excel.
Can I customize the workbook?
Yes. You can edit chart titles, colors, fields, slicers, columns, and workbook formatting.
Can I hide the Support Sheet?
Yes. The Support Sheet contains pivot tables used by the dashboard and can be hidden after setup.
Is this template safe for controlled defense data?
The workbook is a reporting template. Only use data that your organization is authorized to store and analyze in Excel.
Which version of Excel should I use?
Use Microsoft Excel 2016 or later, including Microsoft 365, for best pivot chart and slicer support.
About the Author
Built by PK – Microsoft Certified Professional with 15+ years of Excel, Google Sheets, and Power BI experience. Founder of NextGenTemplates, reaching 300K+ subscribers across YouTube channels. Every template is hand-built and tested before release.
Conclusion
The Defense Equipment Manufacturing Dashboard in Excel is a practical template for teams that need structured manufacturing reporting without building a dashboard from scratch. It brings production, quality, customer, contract, and operations analysis into one Excel workbook, with pivot-driven refresh and slicers for quick filtering.
Download the template here: Defense Equipment Manufacturing Dashboard in Excel.
For more tutorials, visit YouTube.com/@PKAnExcelExpert.