The ERP SaaS Startups Dashboard in Excel gives founders, revenue operations teams, SaaS analysts, product leaders, and customer success managers a structured way to review ARR, MRR, CAC, seats, account records, customer mix, product modules, implementation stages, funding stages, NPS, and growth health from one workbook. Instead of rebuilding charts for every monthly review, teams can update the Data Sheet, click Data > Refresh All, and review all dashboard pages through pivot-driven KPI cards, slicers, and charts.
ERP SaaS startups often track data across billing exports, CRM views, onboarding trackers, customer success notes, and finance spreadsheets. When that information stays fragmented, basic questions become slow: which module drives ARR, which segment costs more to acquire, which region has stronger active rate, and which funding stage produces higher recurring revenue. This Excel dashboard turns those records into a practical management reporting layer.
Key Features of ERP SaaS Startups Dashboard in Excel
- 5 dashboard pages: Overview Page, Revenue Trends, Customer Mix, Product Insights, and Growth Health.
- 5 executive KPI cards: Total ARR, Total MRR, Total Seats, Total Records, and Avg. NPS Score.
- Recurring revenue analysis: Review ARR by year, ARR by product module, MRR by month, MRR by industry, and revenue bands.
- Acquisition cost reporting: Analyze CAC by month, customer segment, product module, and status.
- Customer and product views: Break down seats, plan type, industry, region, implementation stage, startup, account executive, and funding stage.
- Pivot and slicer design: Filter quickly and refresh charts from the Support Sheet after updating the Data Sheet.
If you are new to pivot-based reporting, Microsoft has a helpful guide on how to create a PivotTable to analyze worksheet data.
Dashboard Pages Explanation
1. Overview Page
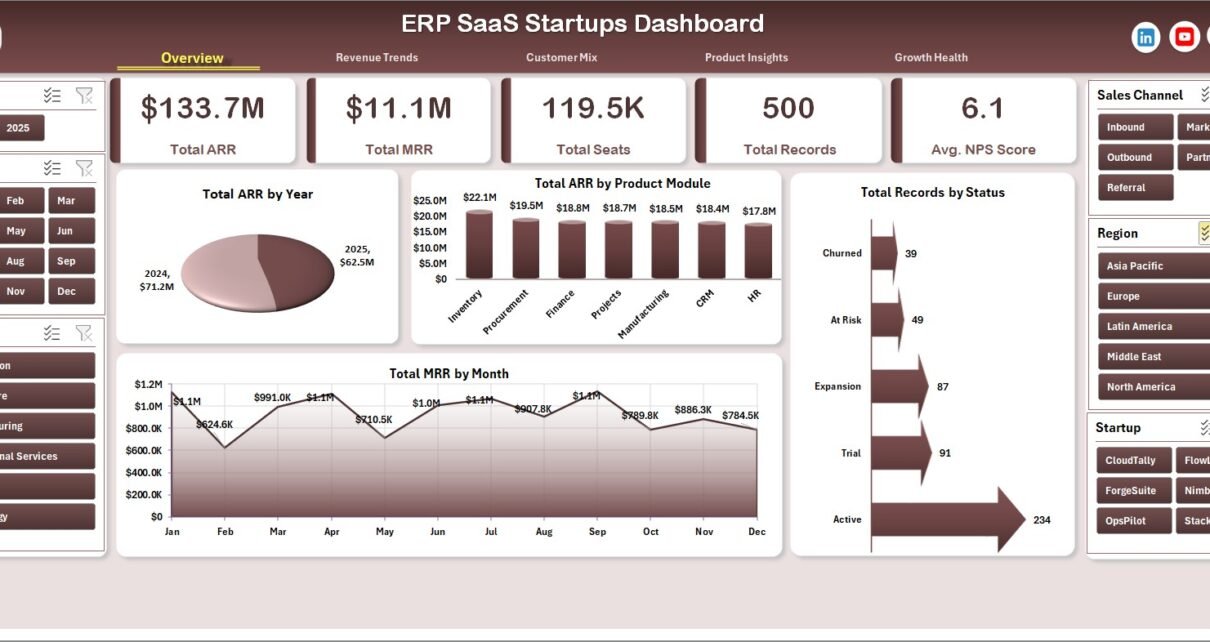
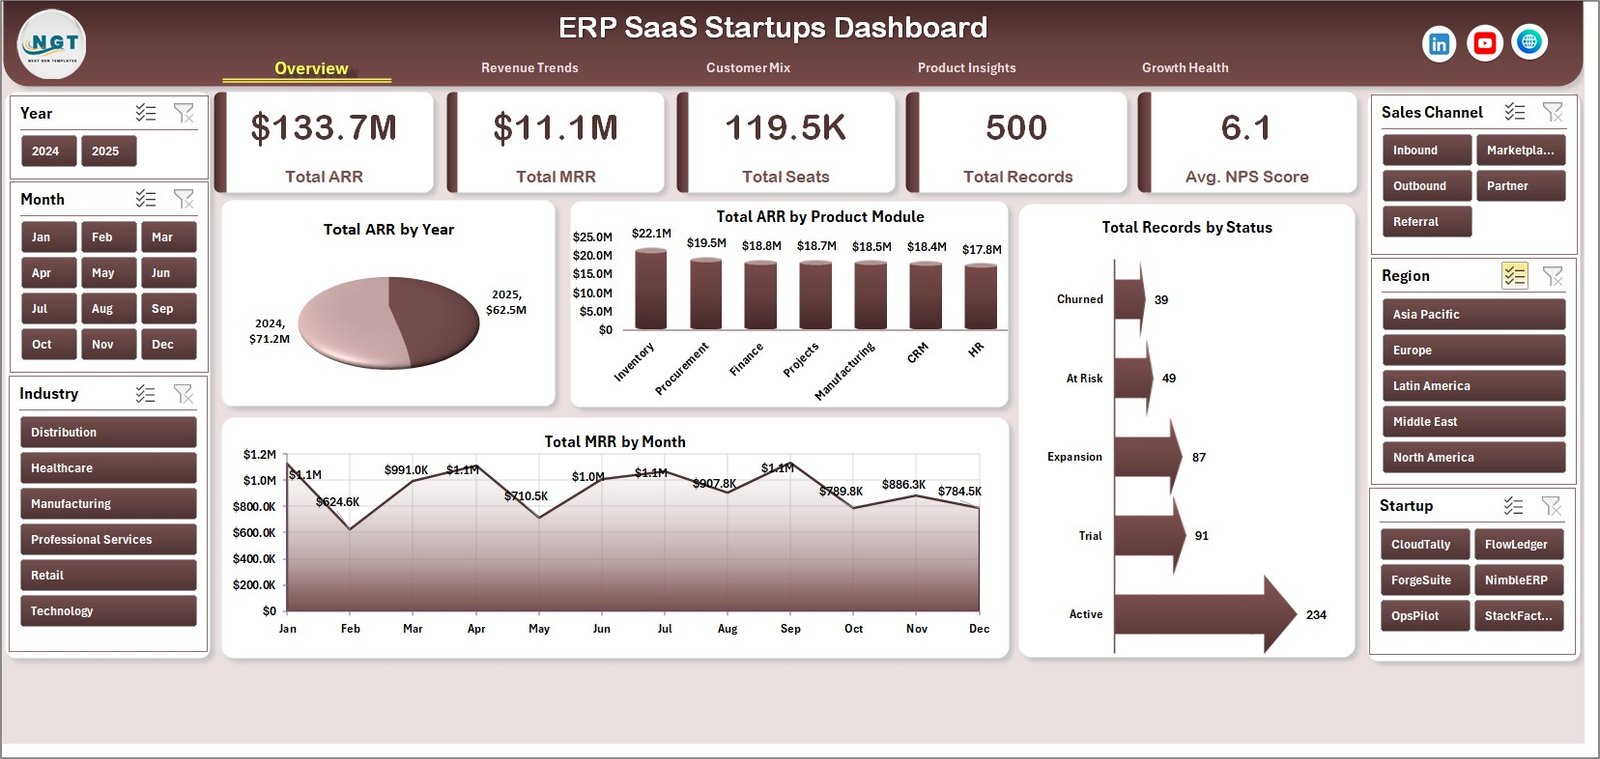
The Overview Page is the executive starting point. At the top of the sheet, the KPI cards show Total ARR, Total MRR, Total Seats, Total Records, and Avg. NPS Score, giving leadership a fast view of revenue scale, active usage, data volume, and customer sentiment.
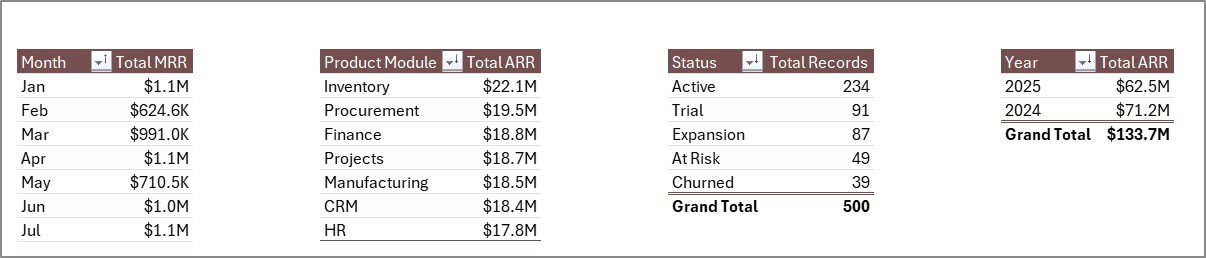
Total ARR by Year shows annual recurring revenue movement across years. This is useful for investor updates, board reporting, and reviewing whether the ERP SaaS business is building durable recurring revenue.
Total ARR by Product Module highlights which ERP modules contribute the highest ARR. Product, sales, and customer success teams can use this to understand whether finance, CRM, HR, inventory, procurement, or other modules are carrying growth.
Total MRR by Month tracks recurring revenue by month so teams can spot momentum, softness, or seasonality. Total Records by Status shows how records are distributed across status groups such as active, onboarding, pending, churned, or any statuses used in the dataset.
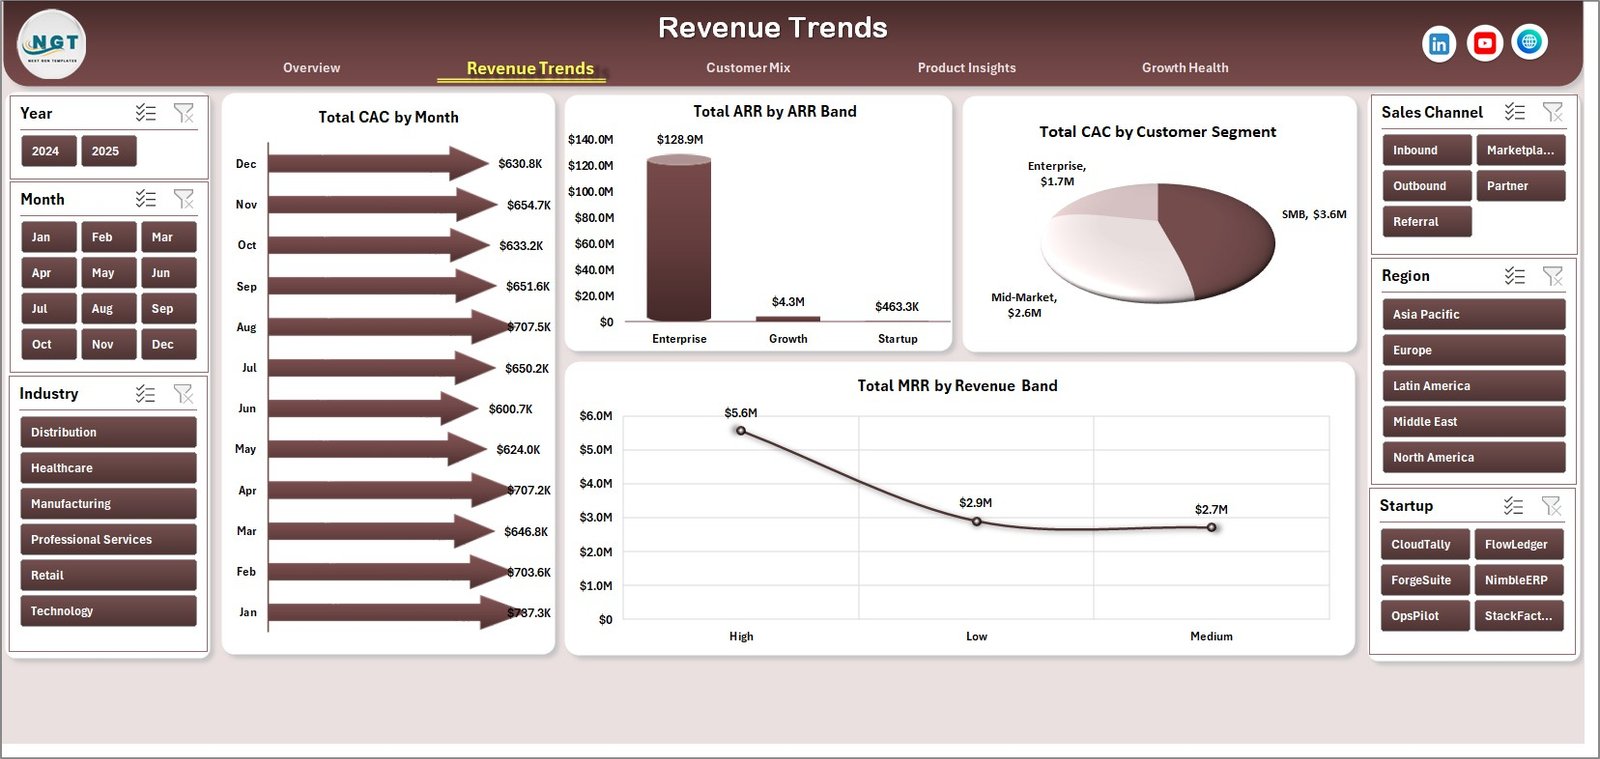
2. Revenue Trends
The Revenue Trends sheet focuses on customer acquisition cost and recurring revenue distribution. It includes Total CAC by Month, Total ARR by ARR Band, Total CAC by Customer Segment, and Total MRR by Revenue Band.
This page helps teams compare acquisition spending with revenue quality. For example, a customer segment may look attractive by logo count but require high CAC, while a revenue band may show where stronger MRR is concentrated.
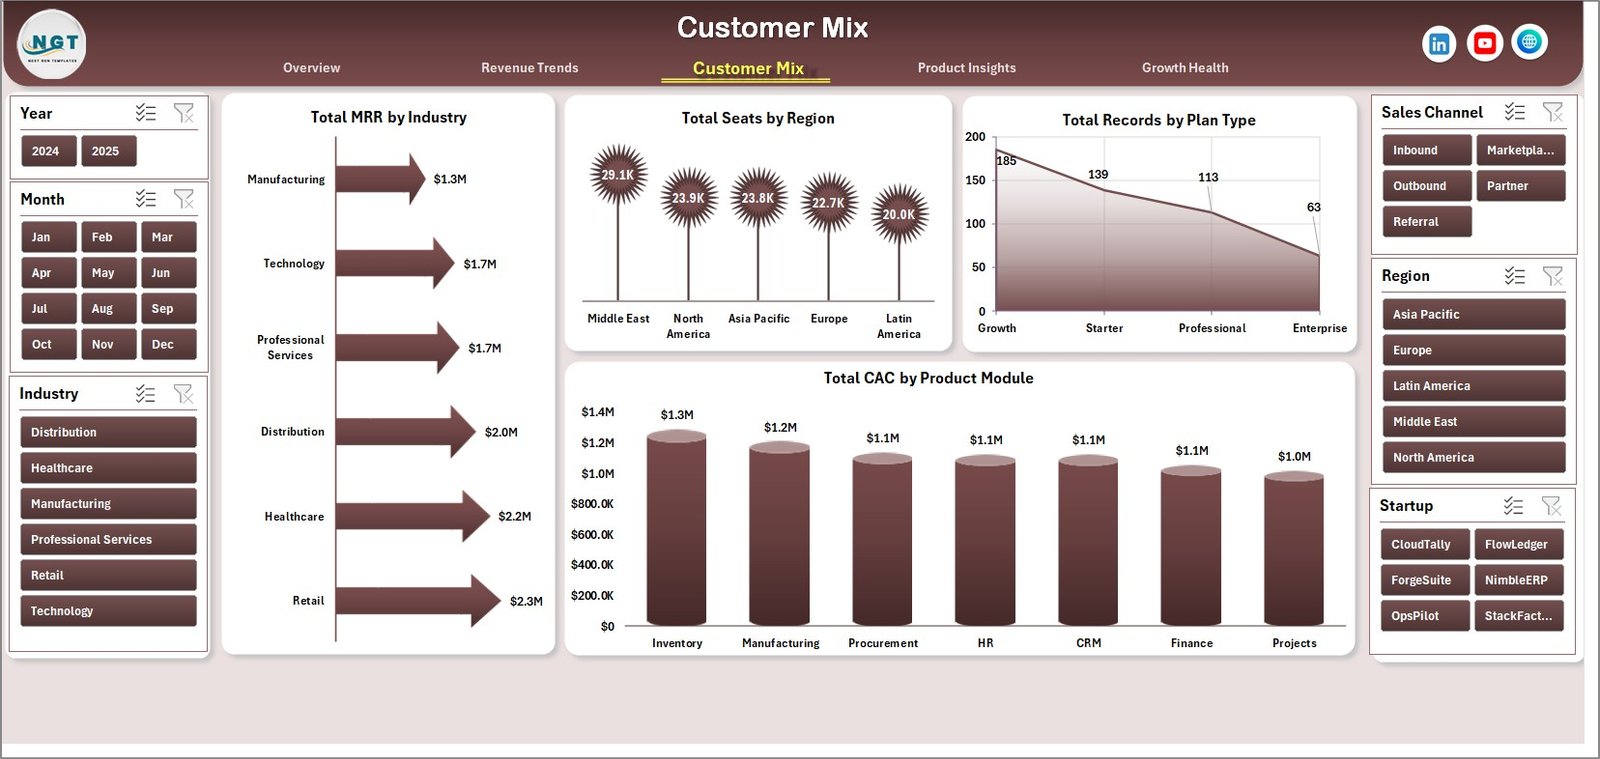
3. Customer Mix
The Customer Mix sheet explains where customers and seats come from. It includes Total MRR by Industry, Total Seats by Region, Total Records by Plan Type, and Total CAC by Product Module.
Use this page to understand which industries produce recurring revenue, which regions have larger seat counts, how plans are distributed, and which modules carry higher acquisition cost. It is especially useful for go-to-market segmentation and account planning.
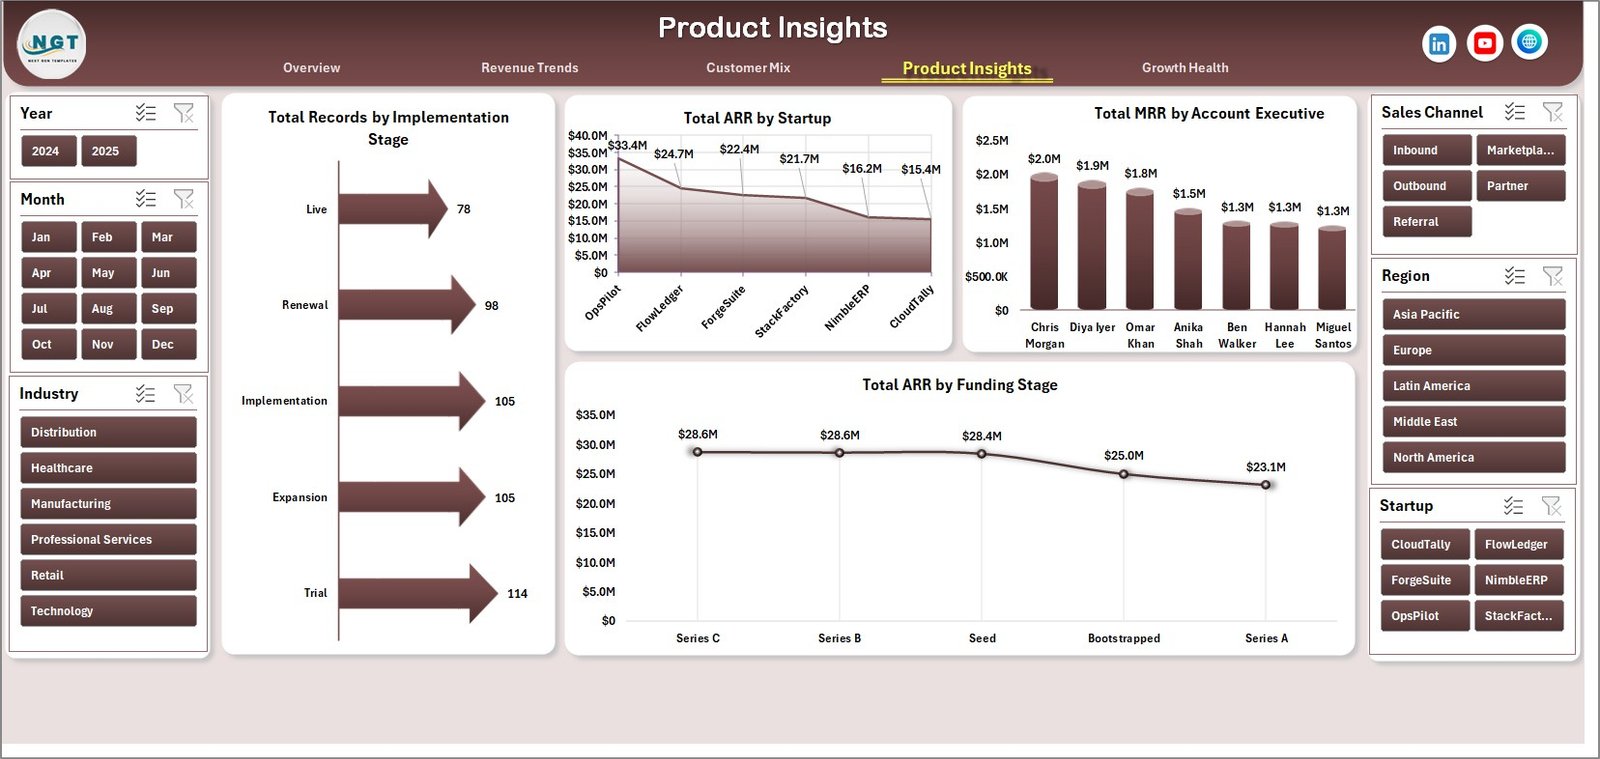
4. Product Insights
The Product Insights sheet connects implementation progress with revenue ownership and company stage. It includes Total Records by Implementation Stage, Total ARR by Startup, Total MRR by Account Executive, and Total ARR by Funding Stage.
Startup operators can use this sheet to compare onboarding progress, account executive contribution, ARR concentration by startup, and whether funded accounts are producing different revenue patterns from earlier-stage accounts.
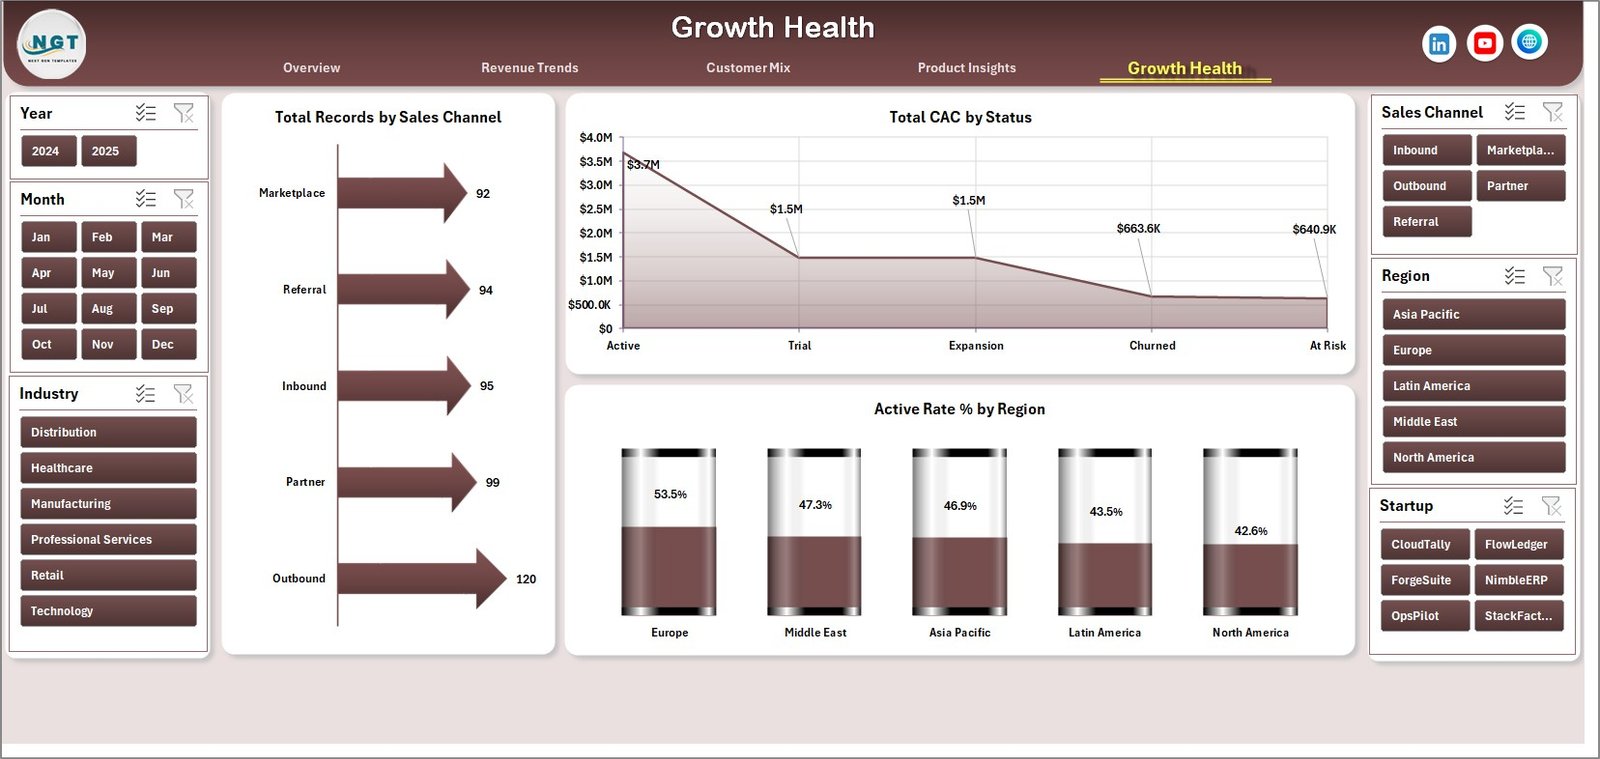
5. Growth Health
The Growth Health sheet brings channel, status, and region health into one page. It includes Total Records by Sales Channel, Total CAC by Status, and Active Rate % by Region.
This is useful for reviewing whether sales channels are creating healthy accounts, whether certain status groups carry high CAC, and where regional active rate is strongest or weakest.
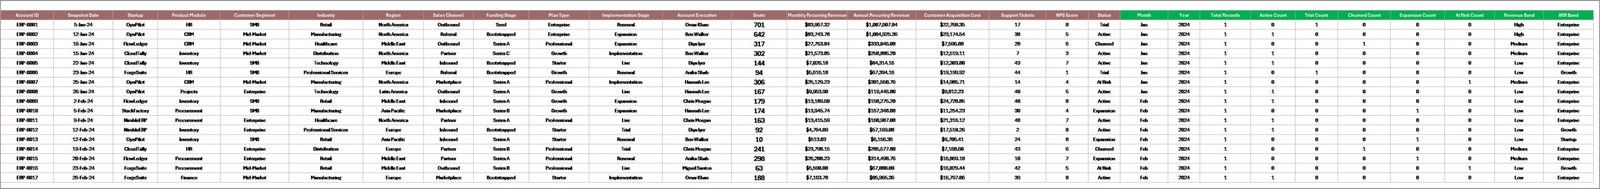
6. Data Sheet Tab
The Data Sheet is the source area where you add ERP SaaS startup records in the same format as the sample data. Keep the same column structure so slicers, pivots, KPI cards, and charts continue to refresh correctly.
7. Support Sheet
The Support Sheet contains the pivot tables used to create the entire dashboard dynamically. After updating the Data Sheet, go to the Data tab in the Excel Ribbon and click Refresh All. You can keep this sheet hidden during normal dashboard use.
ERP SaaS Startups Dashboard in Excel vs. Google Sheets vs. Paid CRM/SaaS – Feature Comparison
| Feature | This Excel Dashboard | Google Sheets Alternative | Paid CRM/SaaS |
|---|---|---|---|
| Cost | $17.99 one-time | Low tool cost, manual build required | Monthly or annual subscription |
| Platform | Microsoft Excel | Browser-based spreadsheet | Vendor-hosted app |
| Setup time | Replace data and refresh pivots | Build charts, formulas, and filters | Implementation and onboarding |
| Real-time team collaboration | Possible through OneDrive or SharePoint | Native browser collaboration | Usually included |
| Mobile access | Limited through Excel mobile or shared file | Browser and mobile app | Vendor app or browser |
| Customizable fields | Editable workbook, pivots, slicers, and charts | Editable, but formulas can break | Limited by vendor settings |
| Share with link | Possible when stored in Microsoft 365 | Native link sharing | Login controlled |
| Year-1 cost at 5 users | $17.99 plus existing Excel access | Low software cost plus build time | Often hundreds or thousands |
| ERP SaaS metrics | ARR, MRR, CAC, seats, NPS, modules, stages, regions | Must be designed manually | Depends on plan and integrations |
Who Should Use This Template
This template is useful for ERP SaaS founders, RevOps teams, SaaS analysts, account executives, customer success leaders, startup portfolio analysts, and consultants who need an Excel view of revenue, acquisition cost, seats, modules, customer mix, implementation, and growth health.
It is not intended to replace a live ERP, CRM, billing tool, product analytics platform, data warehouse, or governed BI environment. It works best as a reporting workbook for prepared data exports or manually maintained startup performance records.
Real-World Use Cases
Nina, seed-stage ERP SaaS founder: Nina uses the Overview and Revenue Trends pages before investor updates to discuss ARR, MRR, CAC, customer status, and recurring revenue bands.
Omar, revenue operations manager: Omar reviews Customer Mix every month to compare MRR by industry, seats by region, plan type distribution, and CAC by module.
Leah, customer success lead: Leah checks Product Insights and Growth Health to connect implementation stage, active rate, NPS, status, and account ownership before renewal meetings.
Advantages of ERP SaaS Startups Dashboard in Excel
- Fast setup: Replace sample data and refresh pivots instead of building a dashboard from scratch.
- One workbook view: ARR, MRR, CAC, seats, NPS, customer mix, and product module analysis sit together.
- Excel flexibility: Teams can edit fields, charts, slicers, colors, and pivots as their reporting model evolves.
- Affordable ownership: One-time purchase with no monthly analytics seat fee.
- Management-ready layout: Each sheet supports a specific leadership discussion.
Opportunities for Improvement
This is an Excel dashboard template, so it depends on data quality and manual refresh. Larger SaaS teams may want to connect the workbook to Power Query, automate exports from CRM or billing systems, add cohort retention views, include expansion and contraction ARR, or move governed reporting to Power BI once the metrics model is stable.
Best Practices
- Keep the Data Sheet headers and field types consistent before refreshing.
- Refresh the workbook after every data update and validate Total ARR and Total MRR against your finance source.
- Clear slicers before sharing screenshots so the visible data matches the meeting context.
- Keep a monthly copy of the workbook for historical snapshots.
- Hide the Support Sheet after refresh so casual users do not edit the pivot engine by mistake.
Explore Relevant Templates
Pair this workbook with SaaS Product Usage Dashboard in Excel when you also need activity, sessions, product usage, and customer health views. You may also like SaaS Metrics Dashboard in Excel for a broader MRR, ARR, churn, retention, and expansion revenue dashboard.
To get the file, visit the ERP SaaS Startups Dashboard in Excel product page.
Frequently Asked Questions
What KPI cards are included?
The Overview Page includes Total ARR, Total MRR, Total Seats, Total Records, and Avg. NPS Score.
How many dashboard pages are included?
The workbook includes 5 main dashboard pages: Overview Page, Revenue Trends, Customer Mix, Product Insights, and Growth Health, plus Data Sheet and Support Sheet tabs.
Do I need advanced Excel skills?
No. You update the Data Sheet and click Refresh All. Basic comfort with Excel is helpful if you want to customize charts or pivots.
Can I use my own ERP SaaS data?
Yes. Replace the sample records with your own data in the same structure, then refresh the workbook.
Does this replace a CRM, ERP, or billing platform?
No. It is a reporting dashboard template, not an operational system, live connector, billing engine, or CRM.
Can I customize the dashboard?
Yes. You can edit charts, slicers, pivots, formatting, sheet names, and fields in Microsoft Excel.
About the Author
Built by PK – Microsoft Certified Professional with 15+ years of Excel, Google Sheets, and Power BI experience. Founder of NextGenTemplates, reaching 300K+ subscribers across YouTube channels. Every template is hand-built and tested before release.
Conclusion
The ERP SaaS Startups Dashboard in Excel helps SaaS teams convert recurring revenue, acquisition cost, seat, customer, product, and growth health records into clear Excel reporting. It is a practical option for founders and operators who want a fast, editable dashboard before investing in heavier BI or SaaS analytics systems.
Click here to purchase ERP SaaS Startups Dashboard in Excel.
Visit the YouTube channel for step-by-step Excel tutorials: Youtube.com/@PK-AnExcelExpert.
Last updated: June 9, 2026.