Executive Coaching Dashboard in Excel is a ready-to-use reporting template for executive coaches, HR teams, leadership development consultants, and coaching firms that need one place to track coaching revenue, sessions, program mix, coach performance, and client outcomes. Instead of preparing separate monthly reports manually, this Excel workbook brings the key information into 7 worksheet tabs with KPI cards, charts, slicers, a structured Data sheet, and a Support sheet powered by pivot tables.
The template is useful when coaching data is already available in rows and columns but the reporting process is slow. You can replace the sample data, refresh the workbook, and review trends by month, quarter, year, program type, coach, client level, industry, region, status, and acquisition channel.
Click here to purchase the Executive Coaching Dashboard in Excel
Key Features of Executive Coaching Dashboard in Excel
- 7 worksheet tabs covering Overview, Coach Analysis, Program Mix, Revenue Trend, Client Outcomes, Data, and Support.
- 4 headline cards for Total Session Fee, Net Coaching Revenue, Total Sessions Completed, and Total Engagements.
- Multiple slicers that help users filter dashboard pages quickly and review specific segments.
- Coach-level analysis for session fees, average client rating, completion rate, and net coaching revenue.
- Program mix analysis by program type, session count, industry, and client level.
- Revenue trend reporting by year, quarter, month, and acquisition channel.
- Client outcome tracking by status, region, completion rate, and average rating.
- Structured Data sheet for entering coaching engagement data in a consistent format.
- Pivot-based Support sheet that can be refreshed after changing the source data.
Dashboard Pages Explanation
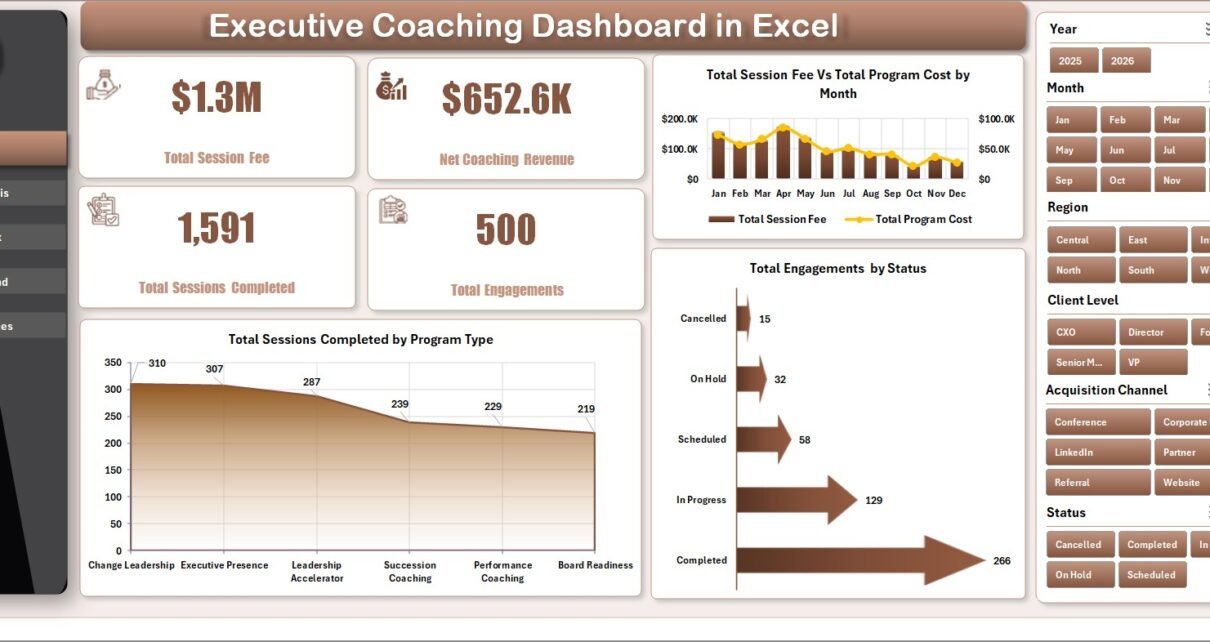
1. Overview Page
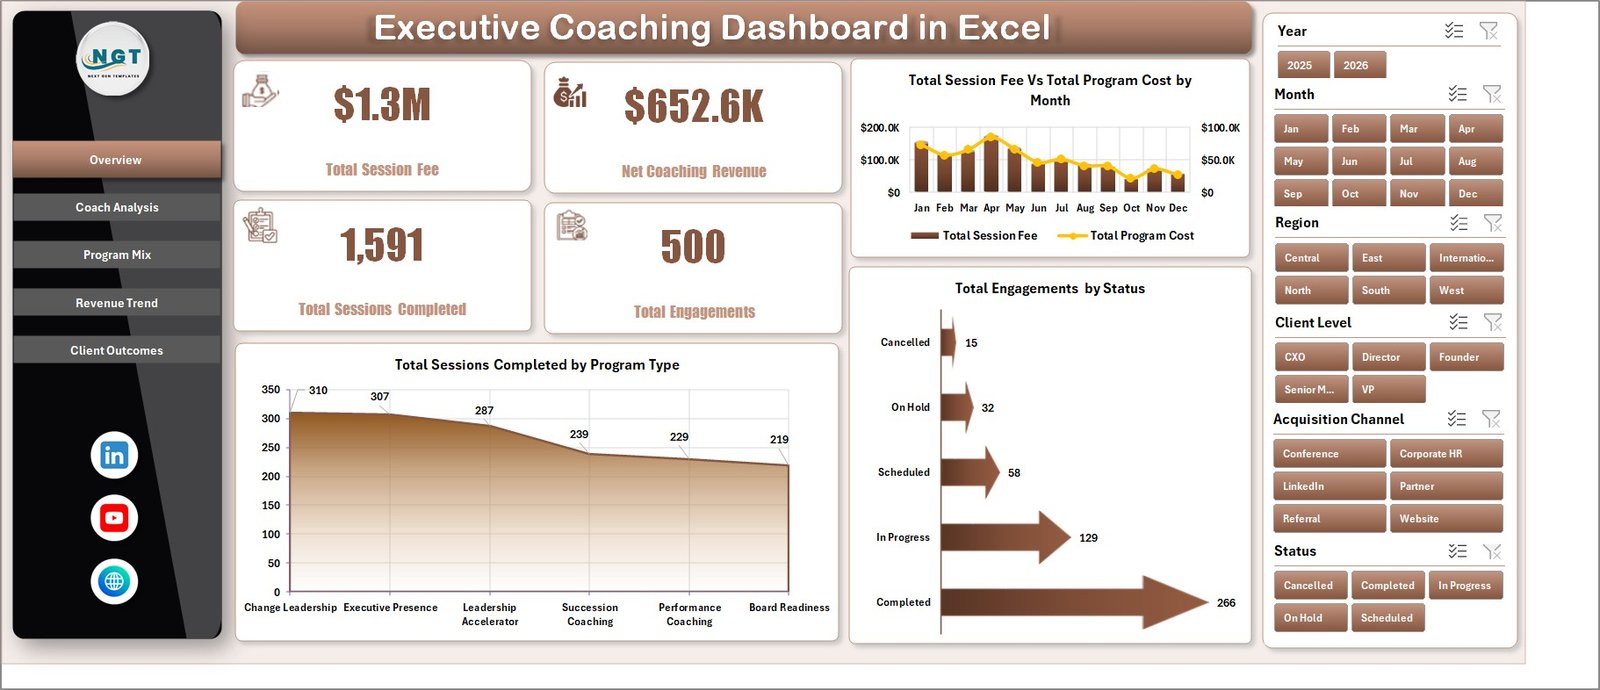
The Overview Page gives a high-level snapshot of the coaching business. At the top, the dashboard displays Total Session Fee, Net Coaching Revenue, Total Sessions Completed, and Total Engagements. These cards help decision-makers understand overall activity, revenue, and delivery progress quickly.
Total Session Fee Vs Total Program Cost by Month: This chart compares monthly session fee revenue with program cost. It helps users find profitable months and identify periods where delivery costs may need a closer review.
Total Sessions Completed by Program Type: This chart shows which coaching program types contribute the most completed sessions. It helps coaching teams understand demand across leadership, executive, transition, performance, or development programs.
Total Engagements by Status: This chart breaks engagements into their current status. It is useful for separating active, completed, paused, and pending coaching work during pipeline and delivery reviews.
Executive Coaching Dashboard in Excel
2. Coach Analysis
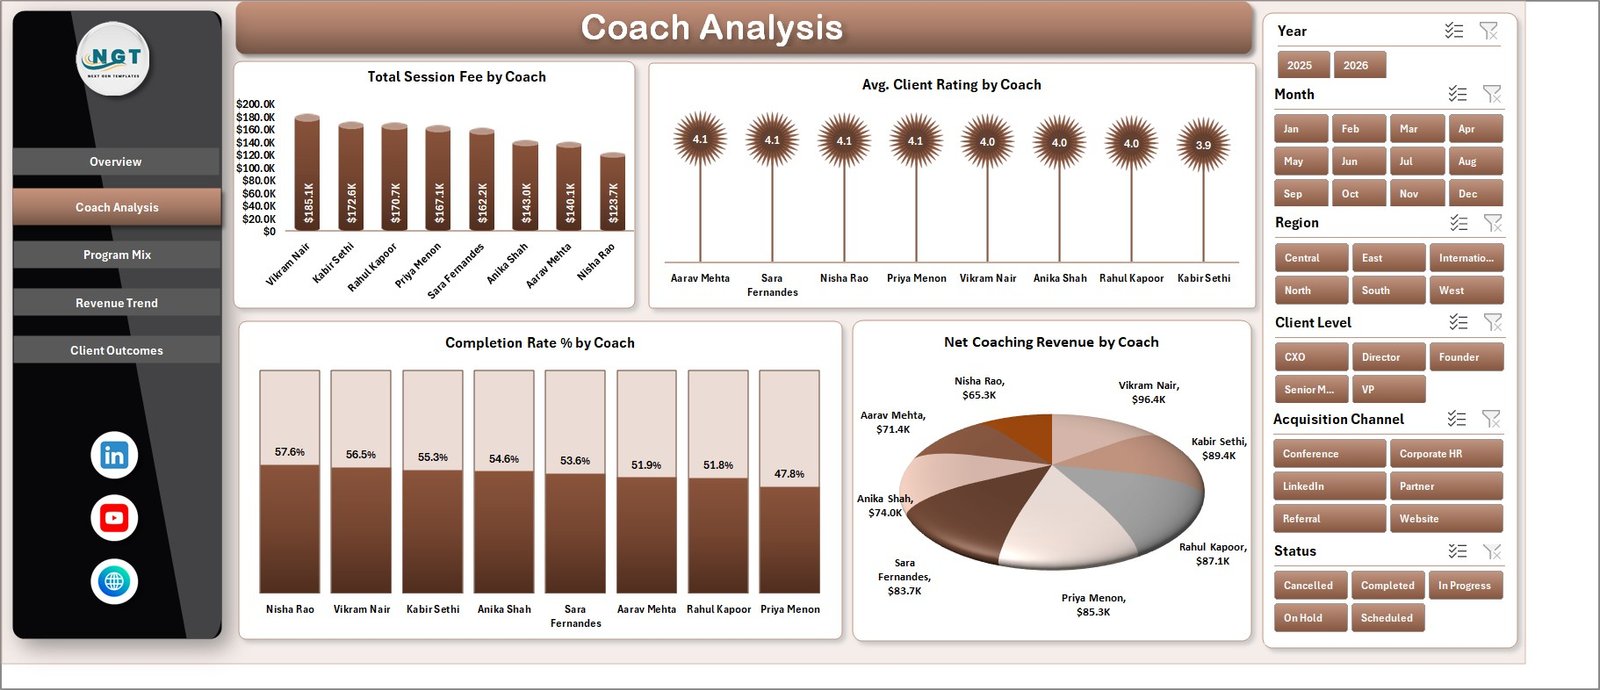
The Coach Analysis tab compares individual coach performance. It includes Total Session Fee by Coach, Avg. Client Rating by Coach, Completion Rate % by Coach, and Net Coaching Revenue by Coach.
This page is especially useful for coaching firm owners and HR leaders who need to understand which coaches are generating revenue, where client satisfaction is strongest, and where completion rates need attention.
Coach Analysis
3. Program Mix
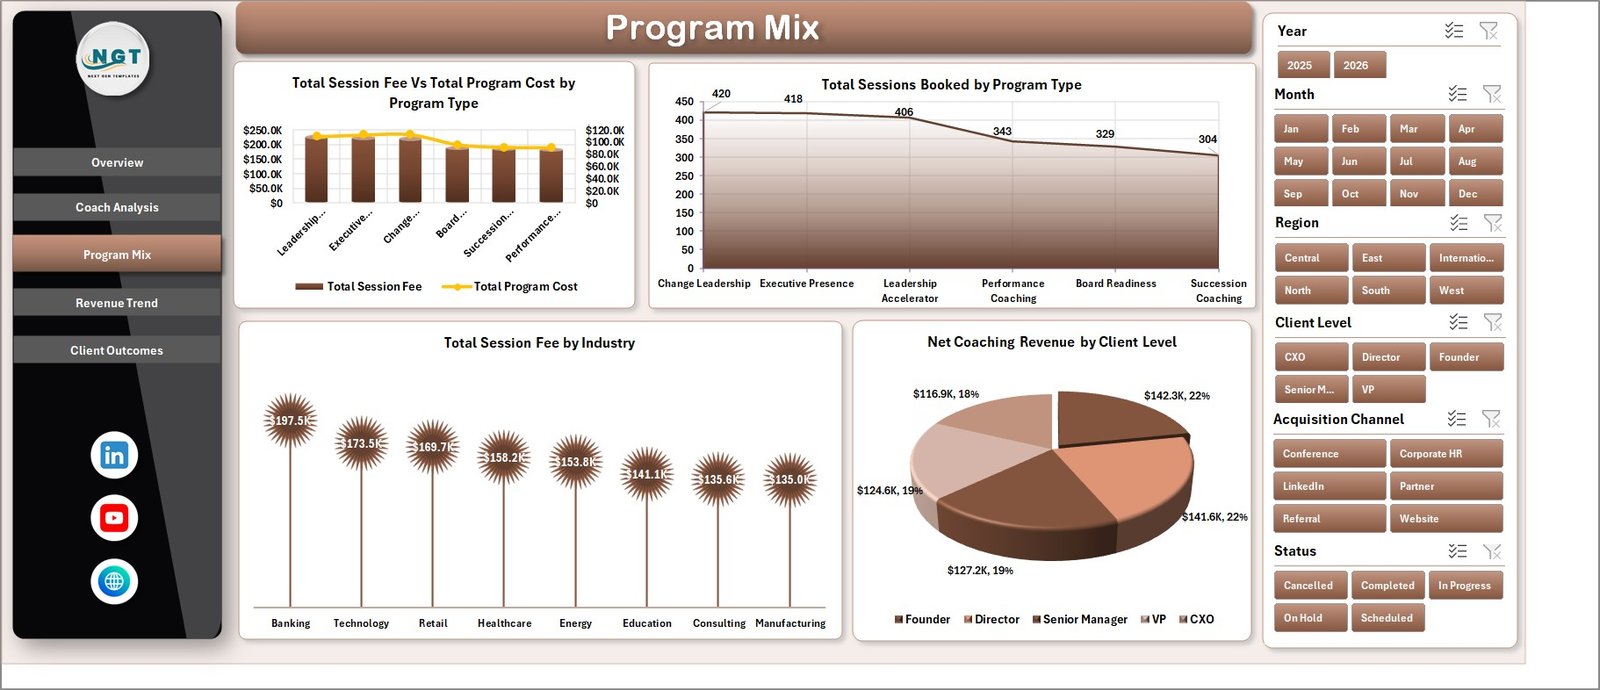
The Program Mix tab focuses on how coaching programs are distributed across program type, industry, and client level. It includes Total Session Fee Vs Total Program Cost by Program Type, Total Sessions Booked by Program Type, Total Session Fee by Industry, and Net Coaching Revenue by Client Level.
Use this page to understand which coaching offers are producing the most revenue, which industries are most active, and whether executive, senior management, or emerging leader clients are contributing differently to net revenue.
Program Mix
4. Revenue Trend
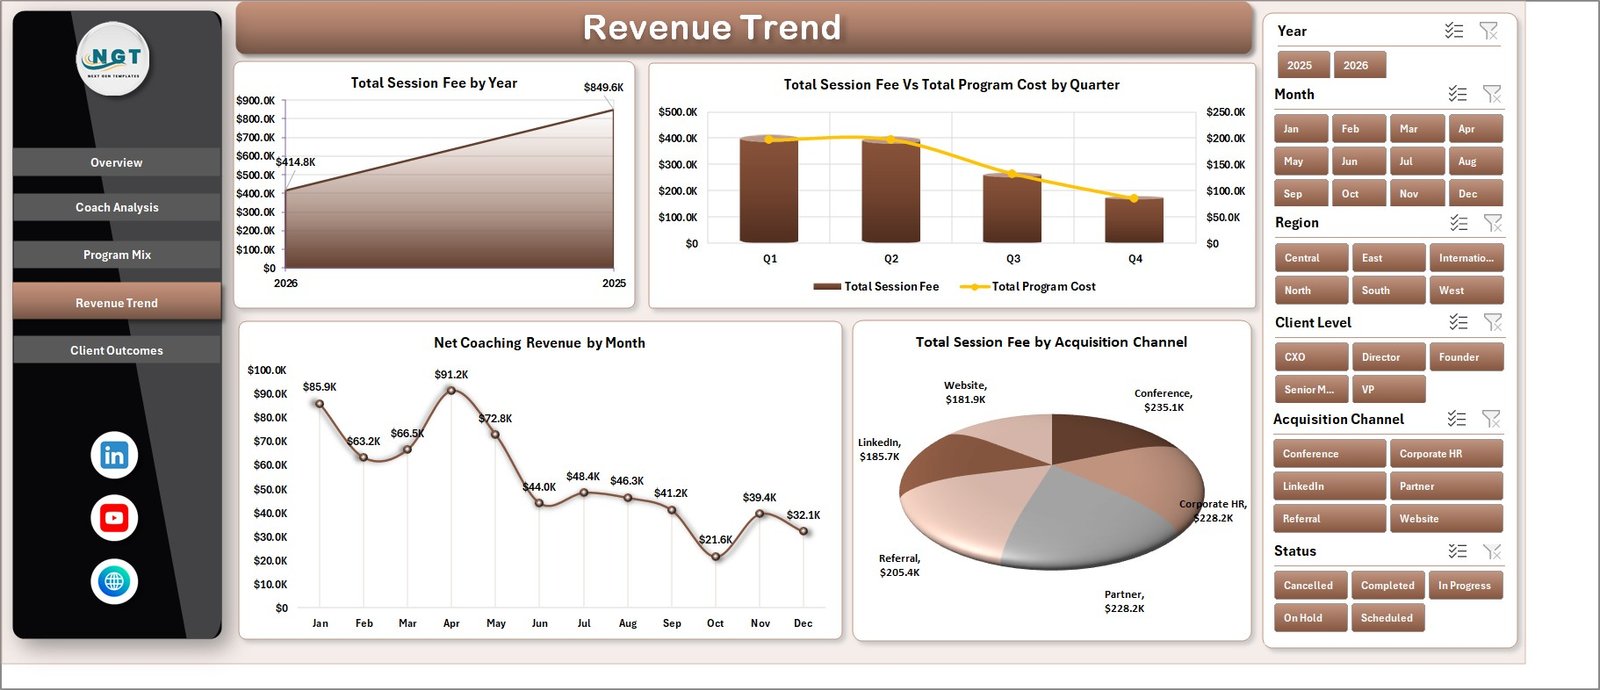
The Revenue Trend tab shows financial movement over time. It includes Total Session Fee by Year, Total Session Fee Vs Total Program Cost by Quarter, Net Coaching Revenue by Month, and Total Session Fee by Acquisition Channel.
This page helps coaching providers review annual growth, quarterly margin movement, monthly net revenue, and the marketing or referral channels that bring in the strongest coaching revenue.
Revenue Trend
5. Client Outcomes
The Client Outcomes tab connects coaching delivery with results. It includes Total Sessions Completed by Status, Completion Rate % by Region, and Avg. Client Rating by Industry.
This page helps teams review where engagements are progressing, which regions have stronger completion rates, and which industries are reporting better client ratings after coaching sessions.
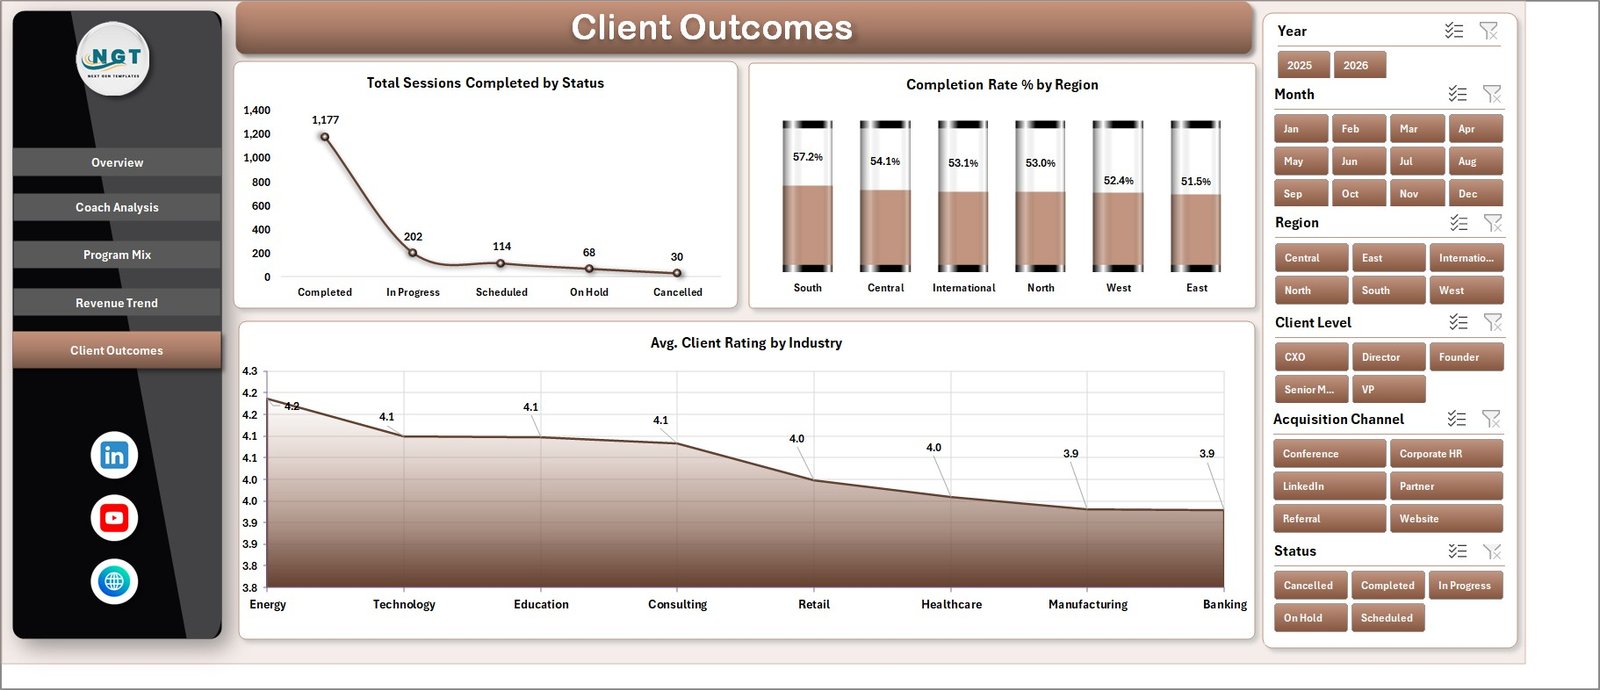
Client Outcomes
6. Data Sheet Tab
The Data sheet is the input table for the workbook. This is where users add coaching engagement records in the same format as the sample data.
Keeping the column format consistent is important because the dashboard pages and pivot tables depend on this structured source. Once the records are updated, the workbook can be refreshed to update the analysis.
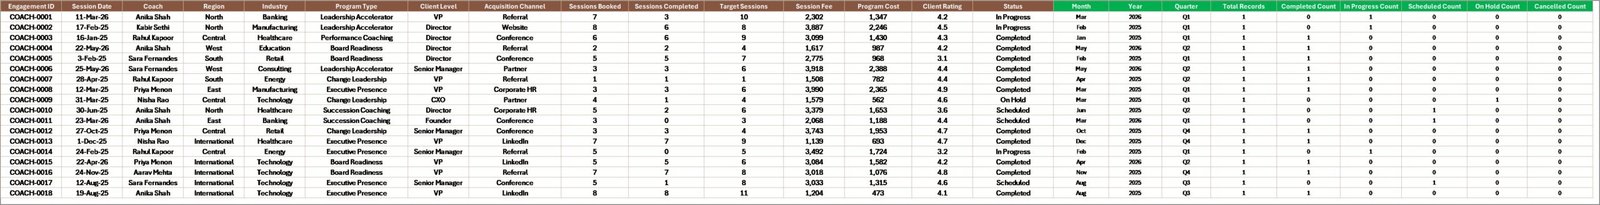
Data Sheet tab
7. Support Sheet
The Support sheet contains multiple pivot tables used to create the dashboard dynamically. After updating the Data sheet, go to the Data tab in the Excel Ribbon and click Refresh All.
All pivots and dashboard charts refresh from the updated data. This sheet can be kept hidden during normal use so end users can focus on the dashboard pages.
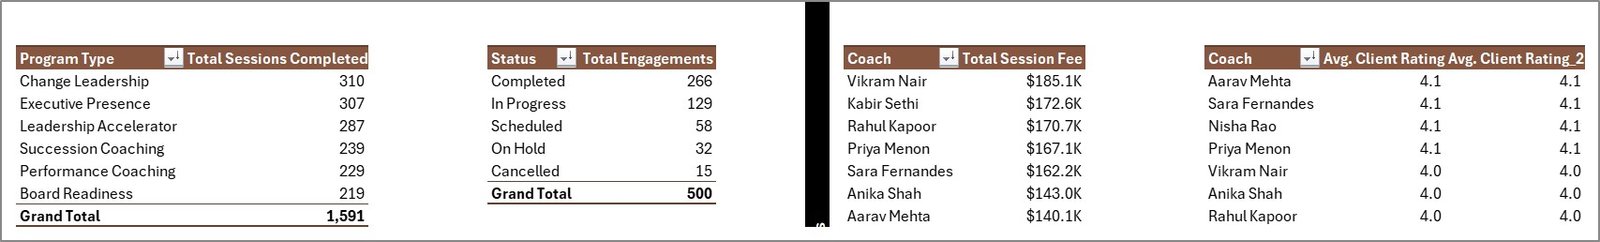
Support sheet tab
Executive Coaching Dashboard in Excel vs. Google Sheets vs. Paid CRM/SaaS – Feature Comparison
| Feature | Executive Coaching Dashboard in Excel | Google Sheets Alternative | Paid Coaching CRM/SaaS |
|---|---|---|---|
| Cost | One-time template purchase | Low-cost template or manual build | Monthly or annual subscription |
| Platform | Microsoft Excel | Browser-based spreadsheet | Vendor cloud system |
| Setup time | Replace data and refresh pivots | Copy, connect, and adapt formulas | Requires configuration and onboarding |
| Collaboration | Best with OneDrive or SharePoint | Built in | Usually built in |
| Mobile access | Excel app or cloud file | Browser or mobile app | Vendor app or browser |
| Customizable fields | Fully editable workbook | Fully editable sheet | Limited by vendor settings |
| Coaching analytics | Built-in revenue, coach, program, and outcome views | Depends on template design | Depends on plan and setup |
| Best fit | Teams that want Excel-based reporting | Teams that prefer live cloud collaboration | Teams that need scheduling, portal, billing, or automation |
Who Should Use This Template
This template is suitable for executive coaches, coaching firms, HR teams, L&D managers, leadership development consultants, business analysts, and internal talent teams that need a repeatable reporting process for coaching activity and outcomes.
It is also helpful for consultants who prepare recurring coaching reports for clients and want a professional Excel workbook instead of building charts from scratch every month.
Real-World Use Cases
Meera, HR Director: Meera uses the Overview and Client Outcomes tabs before quarterly leadership reviews. She can show completed sessions, net coaching revenue, completion rate by region, and average client rating by industry.
Daniel, Coaching Firm Owner: Daniel reviews Coach Analysis every month to compare session fee, client rating, completion rate, and net coaching revenue by coach before assigning new engagements.
Asha, L&D Analyst: Asha uses Program Mix and Revenue Trend to understand which program types, client levels, industries, and acquisition channels are producing the strongest business results.
Advantages of Executive Coaching Dashboard in Excel
- It keeps revenue, delivery, program, coach, and client outcome analysis in one workbook.
- It uses familiar Excel functionality, so teams do not need to learn a new reporting platform.
- It supports fast filtering with slicers for quicker review meetings.
- It includes a Data sheet and Support sheet structure that keeps reporting organized.
- It can be customized for different coaching models, industries, client levels, and regions.
Opportunities for Improvement
Like any spreadsheet dashboard, this template depends on clean source data. Teams should keep naming conventions consistent for coach names, program types, statuses, regions, and industries. If the organization needs automated scheduling, billing, client portals, or real-time CRM workflows, a dedicated SaaS tool may still be required.
Best Practices
- Keep one row per coaching engagement or session record in the Data sheet.
- Use consistent values for program type, coach, region, industry, status, and acquisition channel.
- Refresh all pivot tables after adding or changing data.
- Review the Support sheet before hiding it so you understand how the charts are powered.
- Save a backup copy before making structural changes to formulas, pivots, or charts.
For official Excel help on tables, charts, and PivotTables, visit Microsoft Excel Help & Learning.
Explore Relevant Templates
- Executive Coaching Dashboard in Excel
- Executive Coaching KPI Dashboard in Excel
- KPI Dashboard Library (Excel)
- Browse Excel Dashboard Templates
Frequently Asked Questions
What does the Executive Coaching Dashboard in Excel track?
It tracks Total Session Fee, Net Coaching Revenue, Total Sessions Completed, Total Engagements, program type, coach, client rating, completion rate, industry, client level, region, status, month, quarter, year, and acquisition channel.
Can I use this with my own coaching data?
Yes. Replace the sample records in the Data sheet with your own data while keeping the same column structure.
How do I refresh the dashboard?
After updating the Data sheet, go to the Data tab in the Excel Ribbon and click Refresh All. The pivot tables and charts will refresh from the updated data.
Can I hide the Support sheet?
Yes. The Support sheet contains pivot tables used by the dashboard. You can keep it hidden once the workbook is set up.
Is this a CRM or coaching portal?
No. It is a reporting dashboard for structured coaching data. It does not replace scheduling, billing, client portal, or automated CRM software.
Is this different from the Executive Coaching KPI Dashboard?
Yes. This workbook focuses on coaching sessions, revenue, coach analysis, program mix, revenue trends, and client outcomes. The KPI dashboard focuses more on KPI target-versus-actual tracking.
About the Author
Built by PK – Microsoft Certified Professional with 15+ years of Excel, Google Sheets, and Power BI experience. Founder of NextGenTemplates, reaching 300K+ subscribers across YouTube channels. Every template is hand-built and tested before release.
Conclusion
The Executive Coaching Dashboard in Excel is a practical workbook for turning coaching engagement data into clear business reporting. With pages for overview, coach analysis, program mix, revenue trend, client outcomes, source data, and support pivots, it gives coaches and HR teams a structured way to review revenue, delivery, and outcome metrics in Microsoft Excel.
Download the Executive Coaching Dashboard in Excel from NextGenTemplates
Visit our YouTube channel for step-by-step Excel dashboard tutorials: youtube.com/@PKAnExcelExpert