Hedge Fund Administration Dashboard in Excel helps fund administrators, CFO teams, operations analysts, investor services teams, and finance consultants review fund operations across 7 worksheet tabs, 4 executive KPI cards, 20 analytical charts, slicers, a Data sheet, and a pivot-powered Support sheet. Instead of spending hours rebuilding monthly NAV, capital flow, settlement, fee, and exception reports, users can replace the sample records, click Refresh All, and review a refreshed dashboard in minutes.
Hedge fund operations often involve several moving parts: NAV reporting, subscriptions, redemptions, management fees, performance fees, operating expenses, settlement quality, administrator exceptions, and investor segmentation. This Excel dashboard gives those workflows one structured reporting layer without forcing a team into a recurring fund administration SaaS subscription.

Key Features of Hedge Fund Administration Dashboard in Excel
The workbook is designed as a ready-to-use hedge fund administration reporting template. It includes five dashboard pages, one editable data input sheet, and one Support sheet that contains the pivot tables used by the dashboard visuals.
- 7 worksheet tabs for Overview, Fund Analysis, Investor Flow, Admin Quality, Fee Analysis, Data, and Support.
- 4 KPI cards for Total Operating, Net Capital Flow, Total Management, and Avg. Risk Rating.
- 20 chart views covering NAV, operating expense, capital flows, transactions, settlements, administrator exceptions, fees, asset class, fund, strategy, currency, investor segment, and region.
- Multiple slicers to filter the dashboard quickly and review fund administration performance from different angles.
- Data sheet workflow where users can replace the sample records in the same format and refresh the workbook.
- Pivot-driven Support sheet that can stay hidden after setup while still powering the dashboard dynamically.
Dashboard Pages Explanation
1. Overview Page
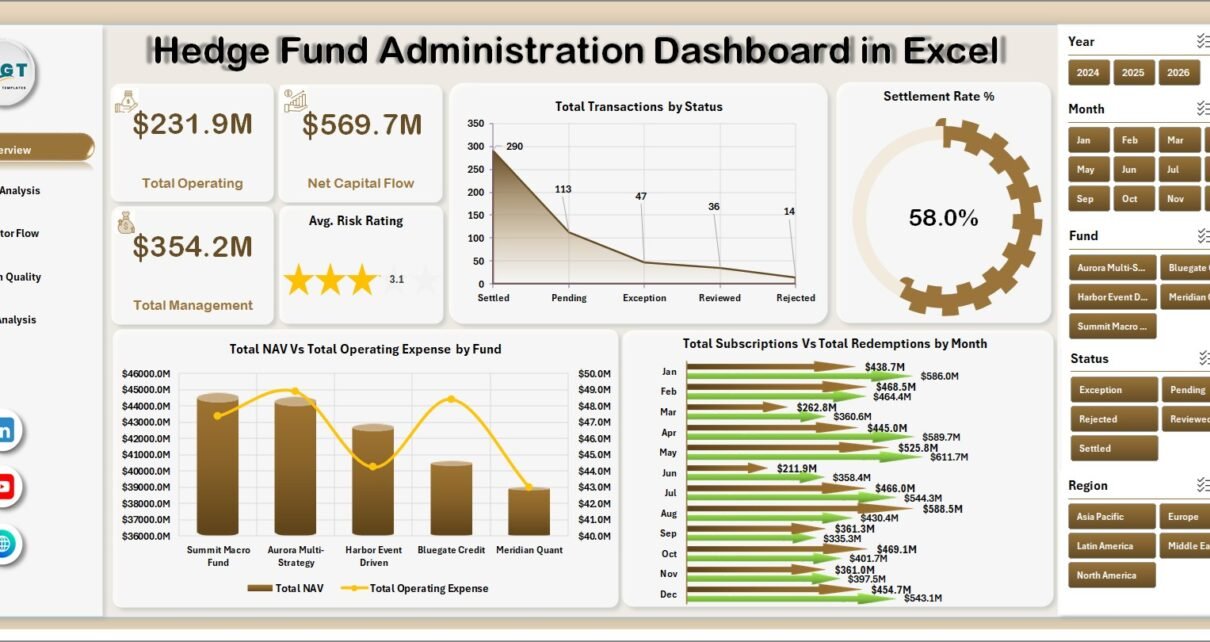
The Overview page is the executive snapshot. At the top, the cards show Total Operating, Net Capital Flow, Total Management, and Avg. Risk Rating. These KPIs help a fund operations team check expense load, capital movement, fee scale, and risk profile before moving into detailed review.
Total Transactions by Status explains how many transactions are sitting in each processing state, which helps administrators identify pending, completed, failed, or exception-heavy areas. Settlement Rate % by Transaction Status adds quality context by showing whether transaction statuses are translating into strong settlement outcomes.
Total NAV and Total Operating Expense by Fund compares fund scale against cost, helping CFO teams see which funds carry higher operating pressure. Total Subscriptions and Total Redemptions by Month shows investor flow trends and makes it easier to explain monthly net movement.
2. Fund Analysis
The Fund Analysis page focuses on fund value, asset class fees, strategy-level investor activity, and investor segment flow. It is useful when finance leaders need to explain which currencies, asset classes, strategies, or investor segments are driving the reporting period.
Total NAV by Currency shows currency-level exposure and reporting concentration. Total Performance Fee by Asset Class helps teams understand where incentive fee contribution is coming from. Total Subscriptions and Total Redemptions by Strategy compares inflows and outflows across investment strategies. Total Subscriptions and Total Redemptions by Investor Segment highlights whether capital activity is concentrated among institutional, private, intermediary, or other investor groups.

3. Investor Flow
The Investor Flow page combines regional fees, quarterly capital flow, operating expense movement, and administrator exceptions. It helps fund operations teams connect investor activity with process quality and cost.
Total Management Fee by Region shows which regions generate the strongest fee contribution. Total Subscriptions and Total Redemptions by Quarter helps management compare quarterly inflow and outflow patterns. Total Operating Expense by Month shows cost movement over time. Total Exceptions by Administrator highlights administrators or processing groups that may need follow-up.

4. Admin Quality
The Admin Quality page is built for operational control. It reviews settlement performance, risk rating, regional transaction load, and strategy-level fee mix.
Settlement Rate % by Region helps identify regions with process delays or lower completion quality. Avg. Risk Rating by Fund compares risk profile across funds. Total Transactions by Region shows where activity volume is concentrated. Total Management Fee and Total Performance Fee by Strategy compares recurring and performance-linked fee contribution across strategies.

5. Fee Analysis
The Fee Analysis page gives a fund accounting and finance view of management fees, performance fees, operating expense, trades, and settlement rate. It is especially useful before month-end or quarter-end reporting.
Total Management Fee and Total Operating Expense by Fund compares fee generation with operating burden. Total Trades by Asset Class shows activity levels by investment type. Total Performance Fee by Month highlights incentive fee movement over time. Settlement Rate % by Fund identifies funds where trade or transaction processing quality may need attention.

6. Data Sheet Tab
The Data sheet is where users add their own hedge fund administration records. Keep the same column structure, replace the sample records, and refresh the workbook so all connected pivot tables and charts update together.

7. Support Sheet Tab
The Support sheet contains multiple pivot tables used to create the entire dashboard dynamically. After updating the Data sheet, go to the Excel Data ribbon and click Refresh All. The pivots and dashboard charts refresh together, and you can keep this sheet hidden for regular users.

Hedge Fund Administration Dashboard in Excel vs. Google Sheets vs. Paid Fund Admin SaaS – Feature Comparison
| Feature | Hedge Fund Administration Dashboard in Excel | Google Sheets Alternative | Paid Fund Admin SaaS |
|---|---|---|---|
| Cost | $17.99 one-time | Low tool cost but manual build work | Monthly or annual subscription |
| Platform | Microsoft Excel | Google Sheets | Vendor cloud platform |
| Setup time | Replace data and refresh | Build formulas, pivots, and charts manually | Onboarding and configuration |
| Real-time team collaboration | Available through OneDrive or SharePoint | Native collaboration | Usually included by plan |
| Mobile access | Excel mobile app | Sheets mobile app | Usually included |
| Customizable fields | Editable workbook, charts, pivots, and slicers | Editable but manual | Depends on vendor permissions |
| Share with link | Available through Microsoft 365 | Native sharing | Usually login controlled |
| Year-1 cost at 5 users | $17.99 plus Microsoft licensing if needed | Low license cost but higher build time | Often hundreds or thousands |
| Fund administration pages | 5 dashboard pages plus Data and Support tabs | Must be created manually | Depends on selected module |
Who Should Use This Template
This template is a good fit for hedge fund administrators, fund accounting teams, CFO and COO teams, investor relations analysts, operations managers, boutique fund consultants, and finance professionals who already manage fund data in Excel and need a cleaner reporting layer.
It is not a replacement for a full accounting platform, investor portal, order management system, custodian reconciliation engine, or regulatory filing tool. If you need live custodian feeds, investor login access, workflow approvals, or automatic trade capture, a specialist system or custom implementation will be better.
Real-World Use Cases
Ravi, fund administration manager: Ravi uses the Overview and Admin Quality pages every Monday to review settlements, transaction status, and administrator exceptions before his operations meeting.
Meera, hedge fund CFO: Meera checks Fee Analysis before month-end close to compare management fee, performance fee, operating expense, trades, and settlement rate by fund.
Daniel, investor relations analyst: Daniel uses Investor Flow and Fund Analysis to prepare a short commentary on quarterly subscriptions, redemptions, investor segment movement, and NAV by currency.
Advantages of Hedge Fund Administration Dashboard in Excel
The first advantage is speed. A pre-built workbook removes the need to create 20 charts, several slicers, KPI cards, and pivot tables from scratch. Users can focus on maintaining clean source data and interpreting the dashboard.
The second advantage is ownership. Since it is an Excel file, users can edit the layout, rename fields, adjust charts, add slicers, change colors, and adapt the workbook to their internal reporting style. There is no vendor lock-in and no monthly subscription from NextGenTemplates.
The third advantage is familiarity. Most fund operations and finance teams already use Excel for monthly reporting, so the learning curve is lower than adopting a new cloud analytics tool.
Opportunities for Improvement
The workbook depends on clean, structured data. If fund names, administrator names, transaction statuses, or investor segments are typed inconsistently, pivot tables may split similar values into multiple groups. Standardizing those fields before refresh will improve reporting quality.
The dashboard is also not a live data integration system. Teams that require automatic feeds from accounting systems, portfolio management systems, custodians, fund administrators, or transfer agents may need a Power BI model, database connection, or custom automation layer.
Best Practices
Keep the Data sheet format unchanged when replacing sample records. Standardize fund names, regions, strategies, currencies, investor segments, transaction statuses, and administrator names before refreshing. Refresh the dashboard after each reporting update, then review the Overview page before drilling into Fund Analysis, Investor Flow, Admin Quality, and Fee Analysis.
For official guidance on refreshing pivot tables, see Microsoft Support’s documentation on refreshing PivotTable data in Excel.
Explore Relevant Templates
You can download the Hedge Fund Administration Dashboard in Excel from NextGenTemplates. You may also like the Hedge Funds KPI Dashboard in Power BI, VC Portfolio Dashboard in Power BI, and Credit Union Dashboard in Power BI. Browse more Excel dashboard templates.
Frequently Asked Questions
What is the Hedge Fund Administration Dashboard in Excel?
It is a ready-to-use Excel dashboard for reviewing hedge fund administration metrics such as NAV, operating expense, capital flows, fees, transaction status, settlement rate, exceptions, risk rating, and investor segments.
What pages are included in the workbook?
The workbook includes Overview, Fund Analysis, Investor Flow, Admin Quality, Fee Analysis, Data Sheet, and Support Sheet tabs.
How do I update the dashboard?
Replace the sample records in the Data sheet, keep the same format, then click Refresh All from the Excel Data ribbon.
Can I hide the Support sheet?
Yes. The Support sheet contains pivot tables used by the dashboard and can be hidden after setup.
Can I customize the charts and slicers?
Yes. The workbook is editable, so you can change fields, chart titles, colors, slicers, and layout in Microsoft Excel.
Is this a subscription?
No. It is a one-time purchase Excel template from NextGenTemplates.
About the Author
Built by PK – Microsoft Certified Professional with 15+ years of Excel, Google Sheets, and Power BI experience. Founder of NextGenTemplates, reaching 300K+ subscribers across YouTube channels. Every template is hand-built and tested before release.
Conclusion
The Hedge Fund Administration Dashboard in Excel gives fund administration and finance teams a practical way to review NAV, operating expenses, fees, settlements, transactions, subscriptions, redemptions, risk ratings, and exceptions in one workbook. If your team already manages fund operations data in Excel, this dashboard can turn that data into a cleaner monthly reporting view with less manual chart-building.
Visit our YouTube channel for step-by-step Excel and dashboard tutorials: Youtube.com/@PKAnExcelExpert.
Last updated: June 19, 2026