Regulatory compliance teams rarely have a data shortage. The harder problem is turning audit records, findings, remediation costs, penalty exposure, reviewer workload, and compliance scores into a report leaders can scan in minutes. A Reg Tech Dashboard in Power BI gives compliance and risk teams a structured way to monitor those signals across regions, institutions, regulation areas, business units, and audit periods.
This template includes 5 Power BI report pages, executive KPI cards, multiple slicers, and chart views for audit status, findings, remediation cost, compliance rate, risk tier, severity, control type, reviewer hours, and monthly trends. It is designed for teams that already have structured compliance or audit data and want a faster reporting layer in Power BI.
Click here to purchase Reg Tech Dashboard in Power BI
Reg Tech Dashboard in Power BI
Key Features of Reg Tech Dashboard in Power BI
- 5 dashboard pages covering Overview, Compliance, Risk Exposure, Remediation, and Audit Trends.
- Executive KPI cards for Total Findings, Total Audits, Total Penalty Exposure, and Compliance Rate.
- Multiple slicers to filter pages quickly by key dimensions such as region, status, risk tier, business unit, institution, or regulation area.
- Regulatory compliance analysis by business unit, regulation area, institution, risk tier, control type, severity, reviewer, and month.
- Editable PBIX structure so Power BI users can adapt measures, visuals, labels, and data model fields to their internal reporting standard.
Dashboard Pages Explanation
1. Overview Page
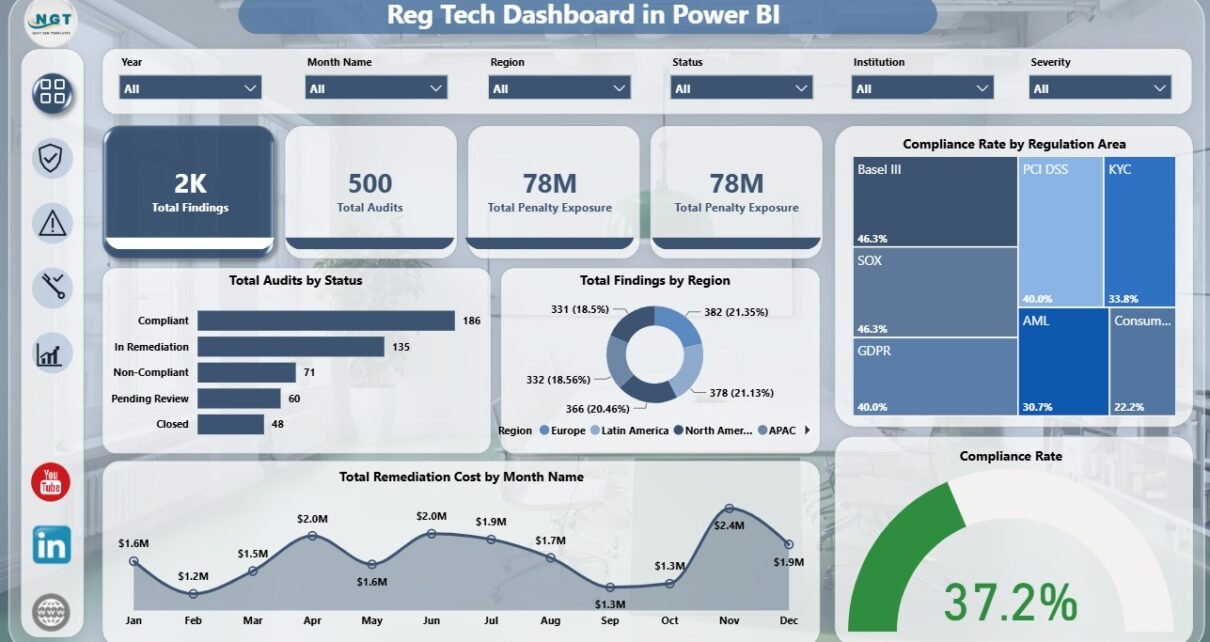
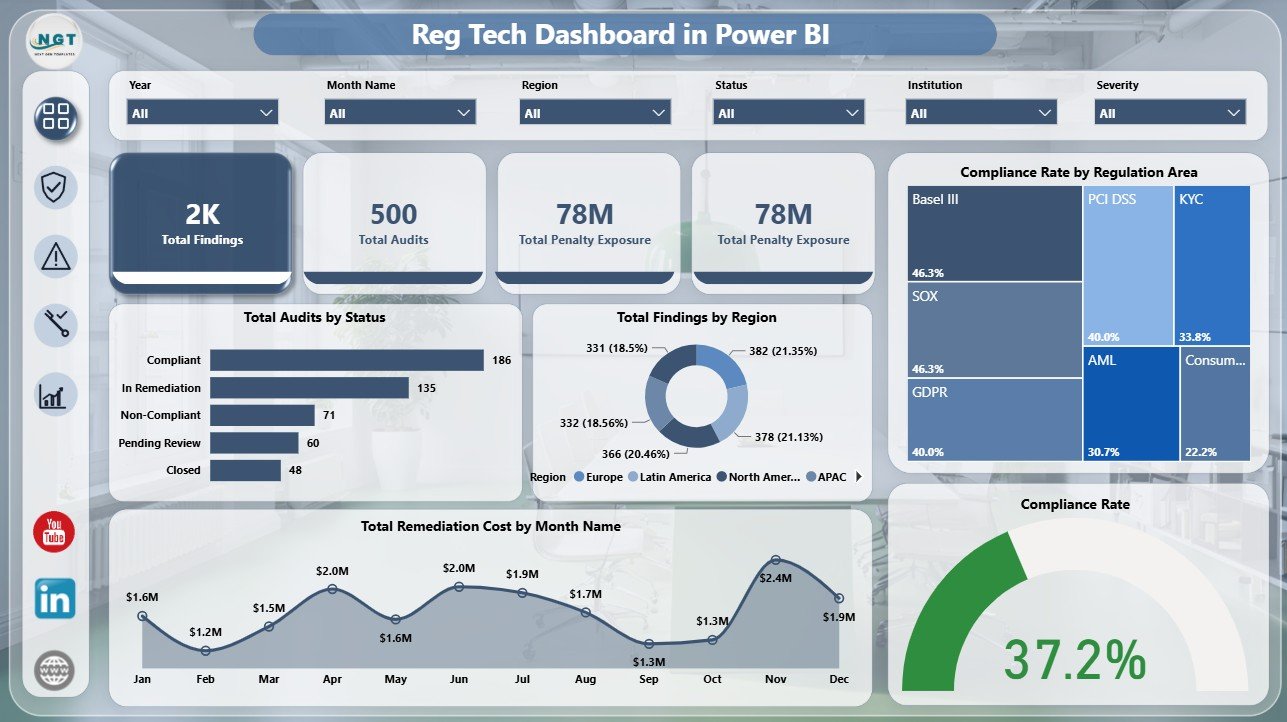
The Overview page is built for a high-level management review. The top cards show Total Findings, Total Audits, Total Penalty Exposure, and Compliance Rate, giving leaders a quick summary of audit volume, compliance health, and financial exposure.
Total Audits by Status shows how audit records are distributed across statuses. This helps teams separate completed work from audits that are open, delayed, or still in remediation.
Total Findings by Region compares findings across geographic areas. It helps identify regions where controls, training, or oversight may need more attention.
Compliance Rate by Regulation Area compares compliance performance across regulatory domains. It helps managers decide which rules or frameworks need deeper follow-up.
Total Remediation Cost by Month Name tracks when corrective action spending occurs. This supports cost planning and helps highlight months where remediation activity is unusually high.
Compliance Rate gives a filtered performance view for the selected dashboard context. It is useful when managers apply slicers and need a fast answer.
Overview Page
2. Compliance
The Compliance page focuses on performance by business unit, institution, risk tier, and regulation area. It is useful for scorecard meetings where leaders need to know who is compliant, where exposure is highest, and which institutions need attention.
Compliance Rate by Business Unit compares compliance outcomes across teams or departments. It helps identify business units that may need additional training, monitoring, or policy support.
Total Penalty Exposure by Risk Tier groups financial exposure by risk tier. This helps leaders focus on high-risk areas before spending time on lower-impact issues.
Average Compliance Score by Institution benchmarks institutions against each other. It is useful for financial services, fintech, and multi-entity organizations.
Compliant Audits by Regulation Area shows where audits are meeting requirements. This can support internal reporting against rules, frameworks, or control families.
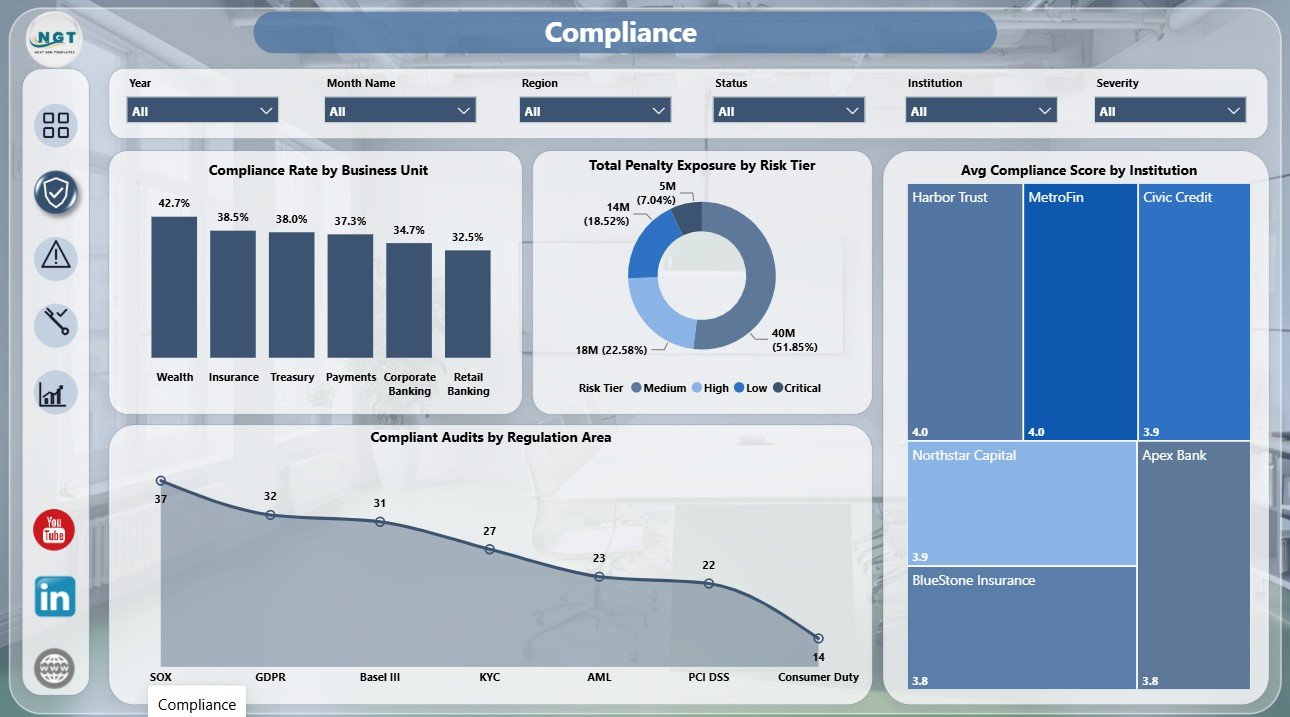
Compliance
3. Risk Exposure
The Risk Exposure page connects financial and operational risk. It is designed for reviews where teams need to compare penalty exposure, remediation cost, audit risk tier, and control weaknesses.
Total Remediation Cost by Severity shows whether critical or high-severity findings are driving cost. This helps teams confirm whether spend is aligned with risk.
Total Penalty Exposure by Region compares possible regulatory penalties across locations. It helps legal, finance, and compliance leaders see where financial exposure is concentrated.
Total Audits by Risk Tier displays audit volume across risk bands. This gives a quick distribution of the risk profile in the selected dataset.
Total Findings by Control Type groups findings by control category. It helps teams identify whether process, IT, detective, preventive, or other control types need improvement.
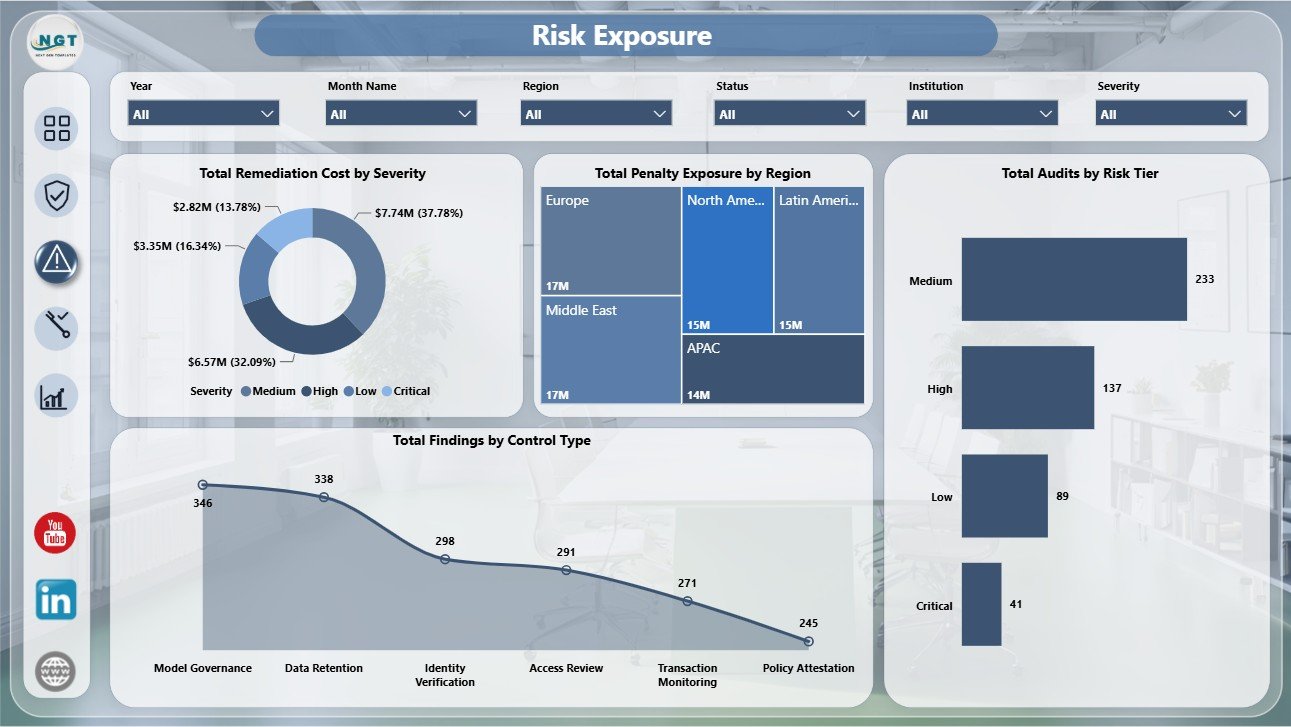
Risk Exposure
4. Remediation
The Remediation page is built for follow-up management. It helps compliance teams track long-term findings, assessment cost, reviewer workload, and audits currently in remediation.
Total Findings by Year shows whether findings are increasing or decreasing over time. This is helpful for annual control reviews and audit committee reporting.
Total Remediation Cost by Assessment Type shows which assessment categories create the highest cost. It can support budget planning across internal audit, external audit, regulatory review, or control testing work.
Total Review Hours by Reviewer compares reviewer workload. This helps managers balance assignments and identify resource pressure.
In Remediation Audits by Month Name tracks active remediation by month. It helps teams spot heavier follow-up periods and manage closure timelines.
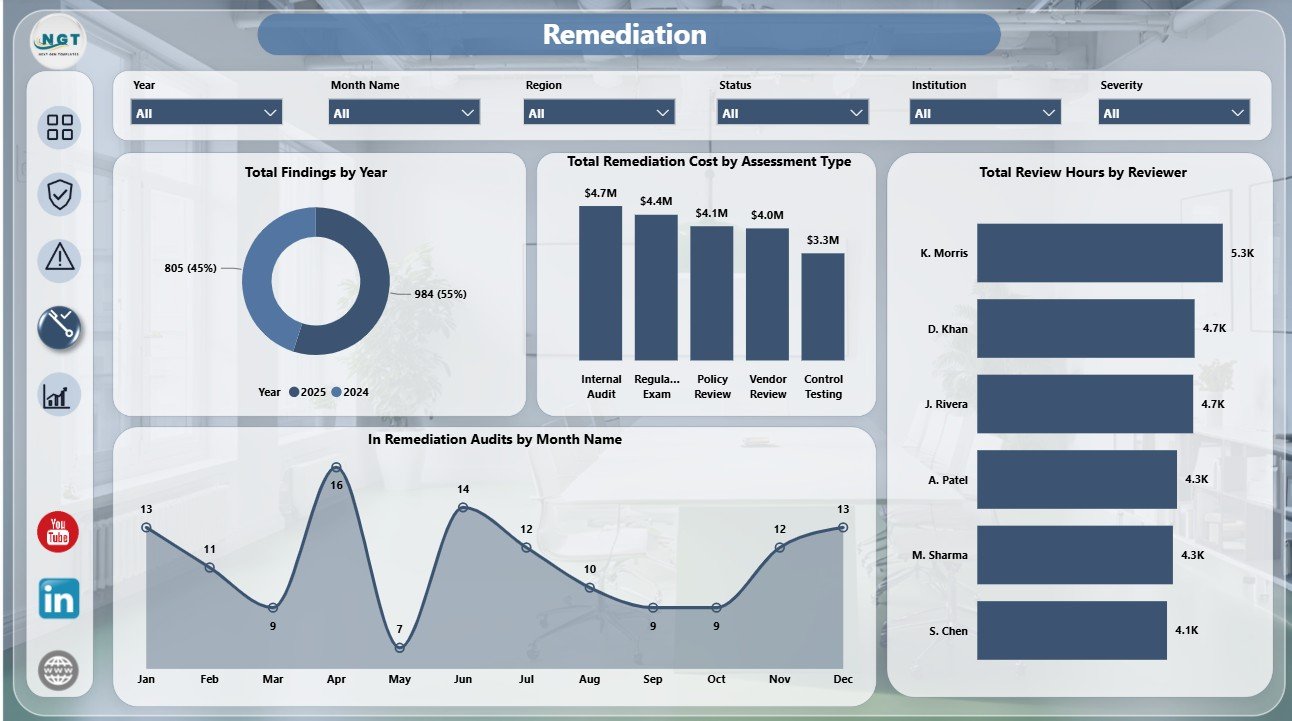
Remediation
5. Audit Trends
The Audit Trends page helps users understand movement over time and concentration by institution, business unit, and region. It is especially useful for recurring monthly or quarterly compliance reviews.
Findings Per Audit by Business Unit compares findings intensity across departments. This is better than raw finding count when audit volume differs by unit.
In Remediation Audits by Region shows where remediation work is active. It helps teams identify regional follow-up pressure.
Critical Severity Audits by Institution highlights institutions with critical audit concerns. This supports escalation and leadership attention.
Compliance Rate by Month Name tracks compliance movement over time. It helps managers see whether corrective actions are improving results.
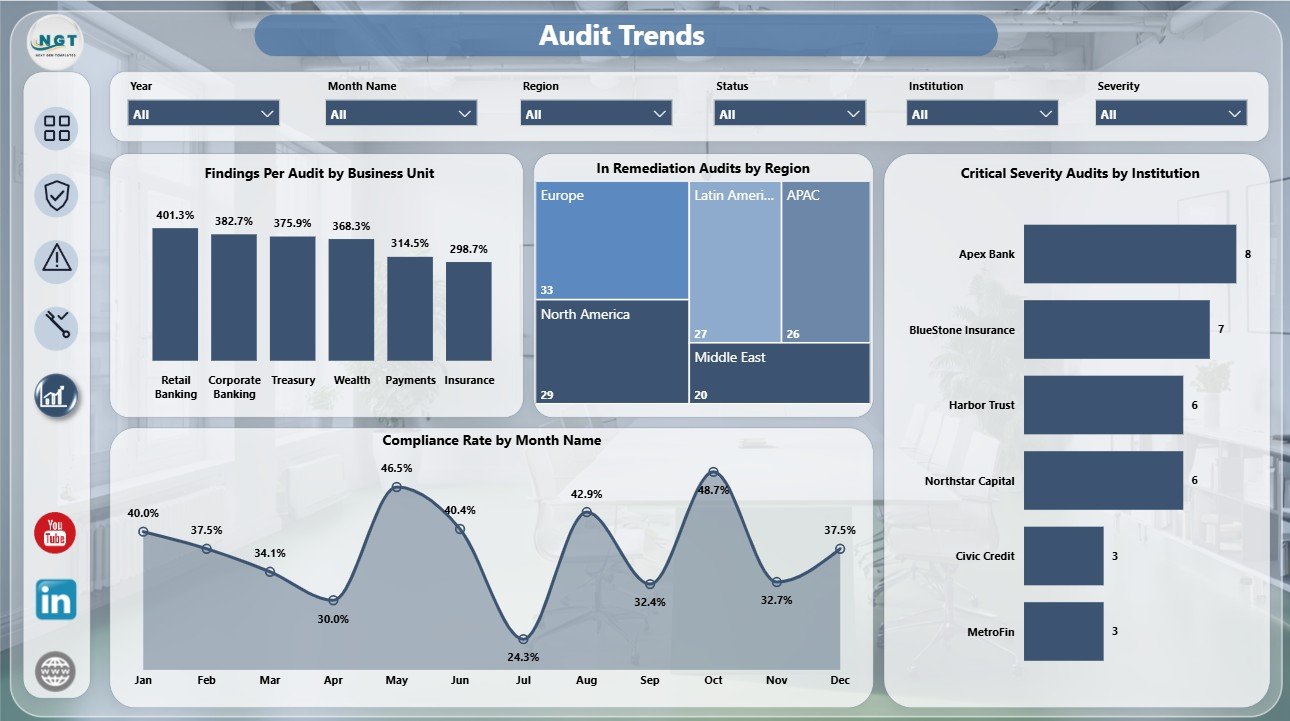
Audit Trends
Reg Tech Dashboard in Power BI vs. Tableau vs. Paid GRC SaaS – Feature Comparison
| Feature | This Power BI template | Tableau alternative | Paid GRC SaaS |
|---|---|---|---|
| Cost | $17.99 one-time sale price | Requires Tableau licensing or workbook build | Usually recurring subscription |
| Platform | Power BI Desktop and Power BI Service | Tableau Desktop or Cloud | Vendor-hosted platform |
| Setup time | Fast when data maps to the template fields | Requires equivalent visual design | Depends on onboarding and configuration |
| Real-time team collaboration | Available through Power BI Service with proper licensing | Available through Tableau Cloud or Server | Usually included |
| Mobile access | Available after publishing | Available after publishing | Usually included |
| Customizable fields | Editable model, visuals, and measures | Editable with Tableau skills | Often limited by admin settings |
| Share with link | Requires Microsoft sharing setup | Requires Tableau sharing setup | Usually role-based access |
| Year-1 cost at 5 users | $17.99 template plus any Microsoft licenses | Licensing and build cost may be higher | Can be hundreds or thousands per year |
| Compliance workflow | Reporting layer only | Reporting layer only | Often includes approvals and evidence tracking |
Who Should Use This Template
This template is for compliance analysts, internal audit teams, regulatory reporting managers, risk officers, banking teams, fintech operators, consultants, and business leaders who need a structured Power BI report for audit and compliance review.
It is a good fit when your team already exports audit or compliance records from another system and needs to convert that data into Power BI visuals. It is not the right tool if you need automated evidence collection, electronic signatures, regulatory filing, legal workflow, immutable audit trails, or a full GRC platform.
Real-World Use Cases
Aditi, Compliance Manager: She reviews Total Penalty Exposure, Compliance Rate, and findings by region before a monthly risk committee meeting.
Rahul, Internal Audit Lead: He filters in-remediation audits by risk tier and institution to decide which findings need escalation this week.
Maya, Regulatory Consultant: She uses the Compliance and Risk Exposure pages to summarize client audit results and remediation priorities in a board-ready format.
Advantages of Reg Tech Dashboard in Power BI
The main advantage is speed. Instead of starting with a blank Power BI canvas, users get a prebuilt reporting structure with pages, slicers, KPI cards, and compliance-focused visuals. Power BI Desktop is available from Microsoft, and Microsoft provides official guidance for installing it through Microsoft Learn. The template keeps the PBIX editable, so analysts can change calculations, fields, colors, and page design.
Opportunities for Improvement
Every organization defines compliance, risk tier, severity, and remediation status differently. Users should review the sample model, map their own fields carefully, and validate every KPI against source records before sharing the report with leaders. Teams should also plan data refresh, workspace permissions, row-level security, and version control before publishing broadly.
Best Practices
- Define each KPI before replacing the sample data.
- Reconcile Total Audits, Total Findings, and Total Penalty Exposure against your source system.
- Keep a clean staging table so Power Query steps stay repeatable.
- Use slicers only for fields that answer recurring management questions.
- Test sharing and permissions before publishing to a Power BI workspace.
Explore Relevant Templates
- Reg Tech Dashboard in Power BI
- Reg Tech Dashboard in Excel
- Recycling Infrastructure Dashboard in Power BI
- Power BI Dashboard Mega Collection
Frequently Asked Questions
What is the Reg Tech Dashboard in Power BI?
It is an editable Power BI dashboard template for regulatory compliance, audit findings, penalty exposure, remediation cost, compliance rate, and audit trend reporting.
Does it work in Power BI Desktop?
Yes. Open the PBIX file in Power BI Desktop, replace the sample data with your own source, and refresh the model.
Can I use my own compliance data?
Yes. Map your audit, findings, region, institution, business unit, risk tier, and remediation fields to the template structure.
Is this a full GRC system?
No. It is a Power BI reporting template, not a full workflow platform for approvals, evidence management, filing, or case handling.
Can I publish it to Power BI Service?
Yes, if your organization has the appropriate Microsoft licensing, workspace setup, and sharing permissions.
Who is this best for?
It is best for compliance teams, internal audit teams, risk managers, financial institutions, fintech teams, and consultants who need a reusable compliance reporting dashboard.
About the Author
Built by PK – Microsoft Certified Professional with 15+ years of Excel, Google Sheets, and Power BI experience. Founder of NextGenTemplates, reaching 300K+ subscribers across YouTube channels. Every template is hand-built and tested before release.
Conclusion
The Reg Tech Dashboard in Power BI gives compliance and audit teams a focused way to review findings, audits, penalty exposure, remediation cost, risk tiers, reviewer workload, and compliance trends. It works best as a reporting layer for structured compliance data, especially when teams want editable Power BI visuals without building every page from scratch.
For more Power BI tutorials and dashboard examples, visit PK-AnExcelExpert on YouTube.