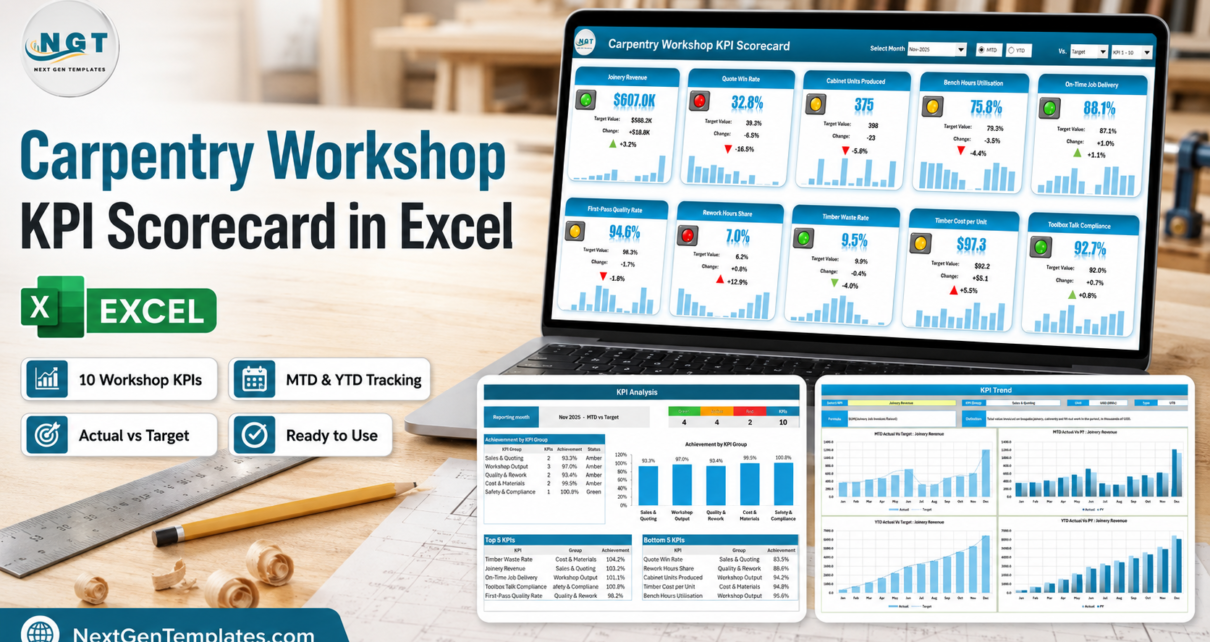
The Carpentry Workshop KPI Scorecard in Excel reports 10 joinery KPIs across 5 KPI groups, spread over 9 worksheets, with room to grow to 20 KPIs. Each KPI carries 12 months of MTD and YTD figures measured against Target and against the prior year, and the whole workbook is built on formulas – no macros, no Power Query, no add-ins. In the sample month shipped with the file (Nov-2025) the shop reads 4 Green, 4 Amber and 2 Red out of 10.
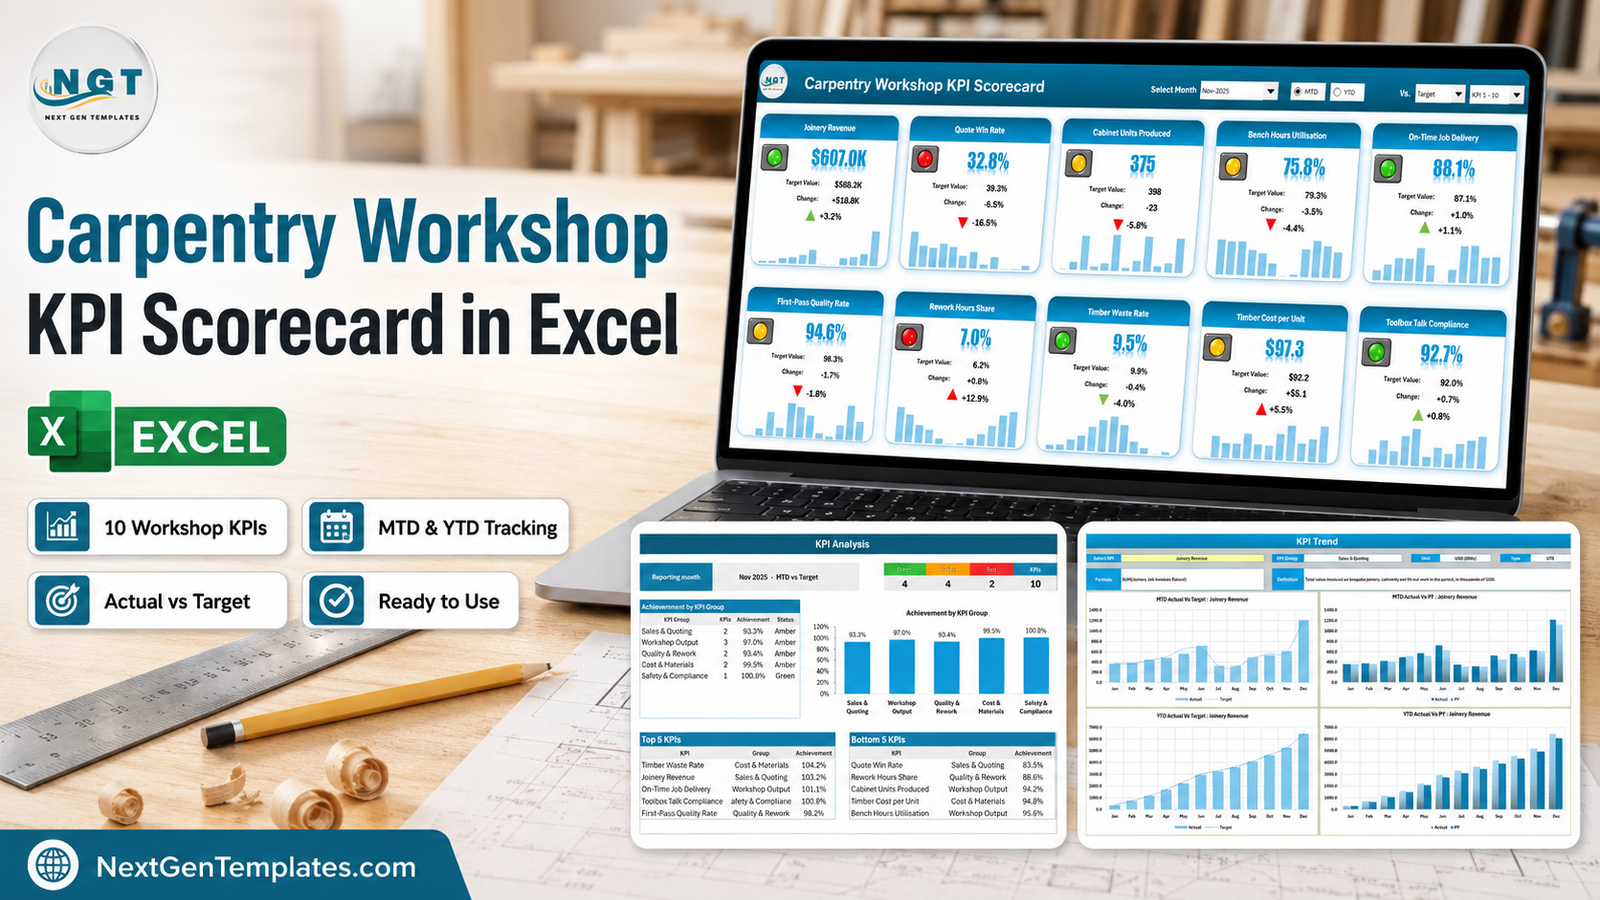
Most small joinery and cabinet workshops already know their numbers – what they do not have is one page that puts those numbers next to a target and colours them. Revenue lives in the accounts package, bench hours live in a timesheet, rework lives in someone’s head, and the monthly meeting turns into an argument about which figure is right. This scorecard is the reporting layer that sits on top of all of that: you type the finished monthly figures once, and it does the variance, the traffic light, the ranking and the trend.
One clarification before anything else. NextGenTemplates publishes three families with confusingly similar names, and this is the smallest and most focused of the three. The KPI Scorecard is a month-picker tile wall driven by figures you type. The KPI Dashboard line is a larger 14-15 KPI report. The analytical Excel Dashboard line is something else again – pivot tables and slicers over a 500-row transaction table. If you want to measure ten headline numbers a month, you want this one.
Key Features of the Carpentry Workshop KPI Scorecard in Excel
- Ten carpentry KPIs in five groups. Sales & Quoting (Joinery Revenue, Quote Win Rate), Workshop Output (Cabinet Units Produced, Bench Hours Utilisation, On-Time Job Delivery), Quality & Rework (First-Pass Quality Rate, Rework Hours Share), Cost & Materials (Timber Waste Rate, Timber Cost per Unit) and Safety & Compliance (Toolbox Talk Compliance).
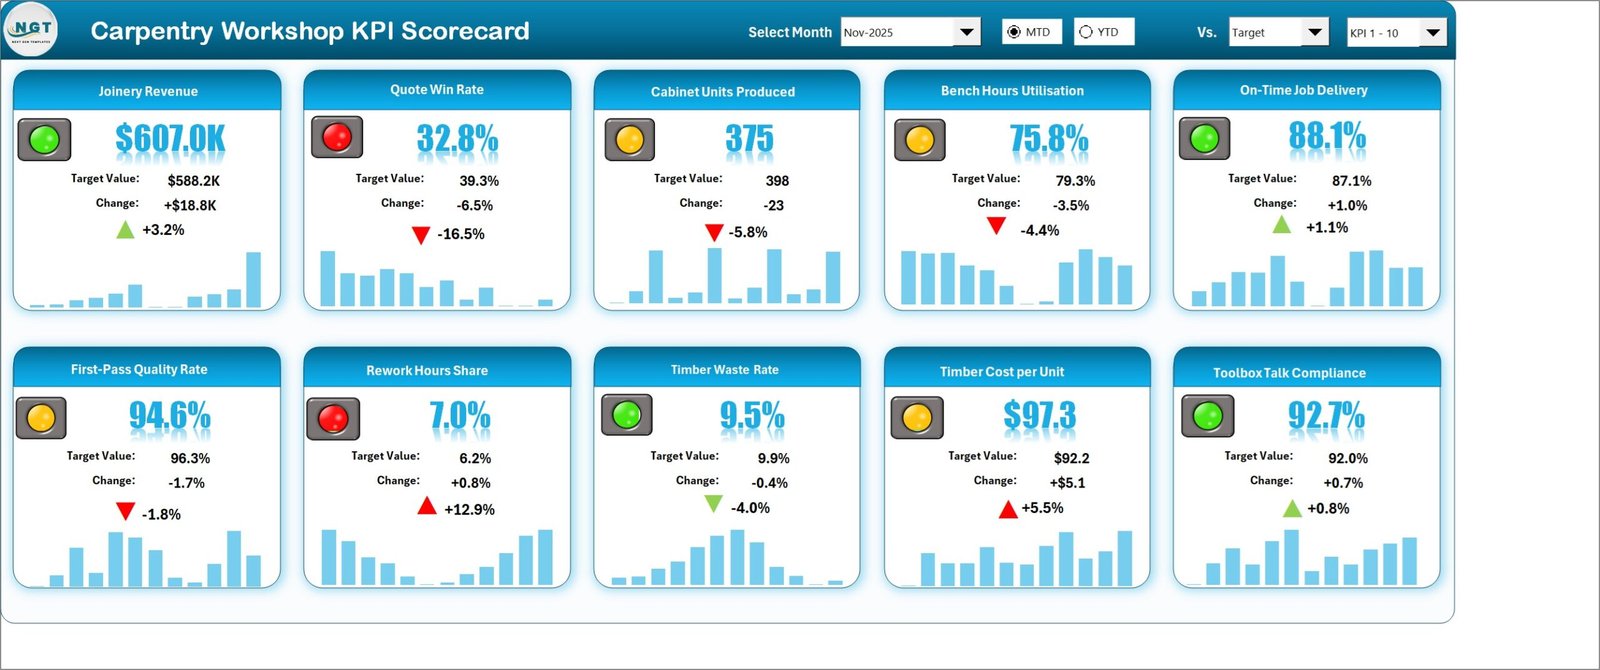
- Direction-aware scoring. Seven KPIs are UTB (upper the better) and three are LTB (lower the better) – Rework Hours Share, Timber Waste Rate and Timber Cost per Unit. The traffic light and the arrow both follow the direction, so a climbing waste rate reads red.
- A month picker with three comparison modes. Choose any month of the reporting year, flip the page between MTD and YTD, and compare Actual against Target, against the same period last year, or against the Prior Month.
- Editable RAG bands. Green is at or above the comparison value, Amber is within 10%, Red is more than 10% off. Both band tables live on one sheet and every page re-colours when you change them.
- A 12-month sparkline in every KPI tile, so the shape of the year is visible without leaving the Scorecard.
- Room for 20 KPIs, switched in the header with a KPI 1-10 / KPI 11-20 picker. Adding number eleven means typing a row and filling a block – no formula editing.
- 100% formulas. Conditional formatting, camera pictures and sparklines only. It opens on Excel 2016 and later, Microsoft 365, and Excel for Mac, with no macro prompt and no IT approval.
Sheets Explanation
Nine visible sheets, plus two hidden calculation sheets that assemble the tiles. Four of them are worth looking at closely.
Scorecard
The month tile wall and the page you will live in. Ten cards, each with a traffic light, the current value, the target value, the absolute change, the percentage change and a 12-month spark bar. In the shipped sample, Joinery Revenue reads $607.0K against a $588.2K target (+$18.8K, +3.2%, green), Quote Win Rate reads 32.8% against 39.3% (-16.5%, red) and Rework Hours Share reads 7.0% against a 6.2% target – red, because on an LTB metric being above target is bad news.
KPI Analysis
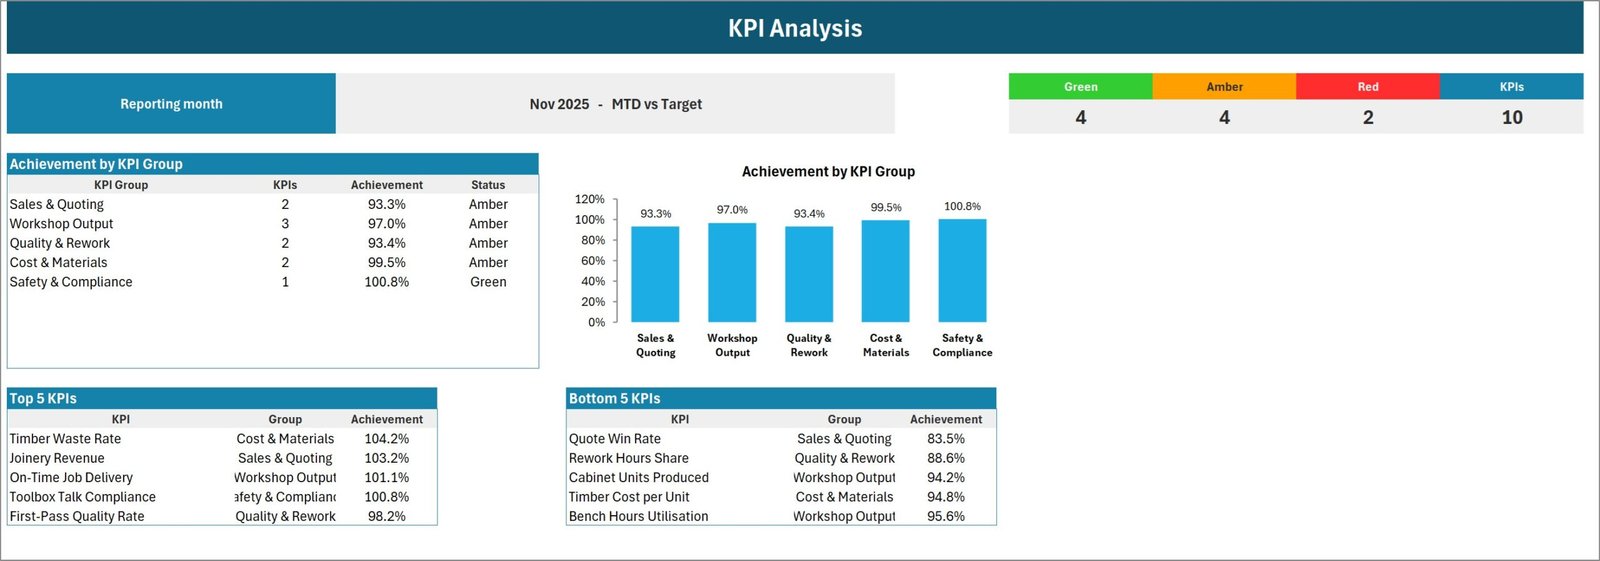
The roll-up. A Green / Amber / Red counter for the selected month, an Achievement by KPI Group table with a status per group, a chart of Achievement by KPI Group, and Top 5 KPIs and Bottom 5 KPIs tables ranked by achievement. In the sample month, Safety & Compliance is the only green group at 100.8%, while Sales & Quoting sits at 93.3% because Quote Win Rate is running at 83.5% of target.
KPI Trend
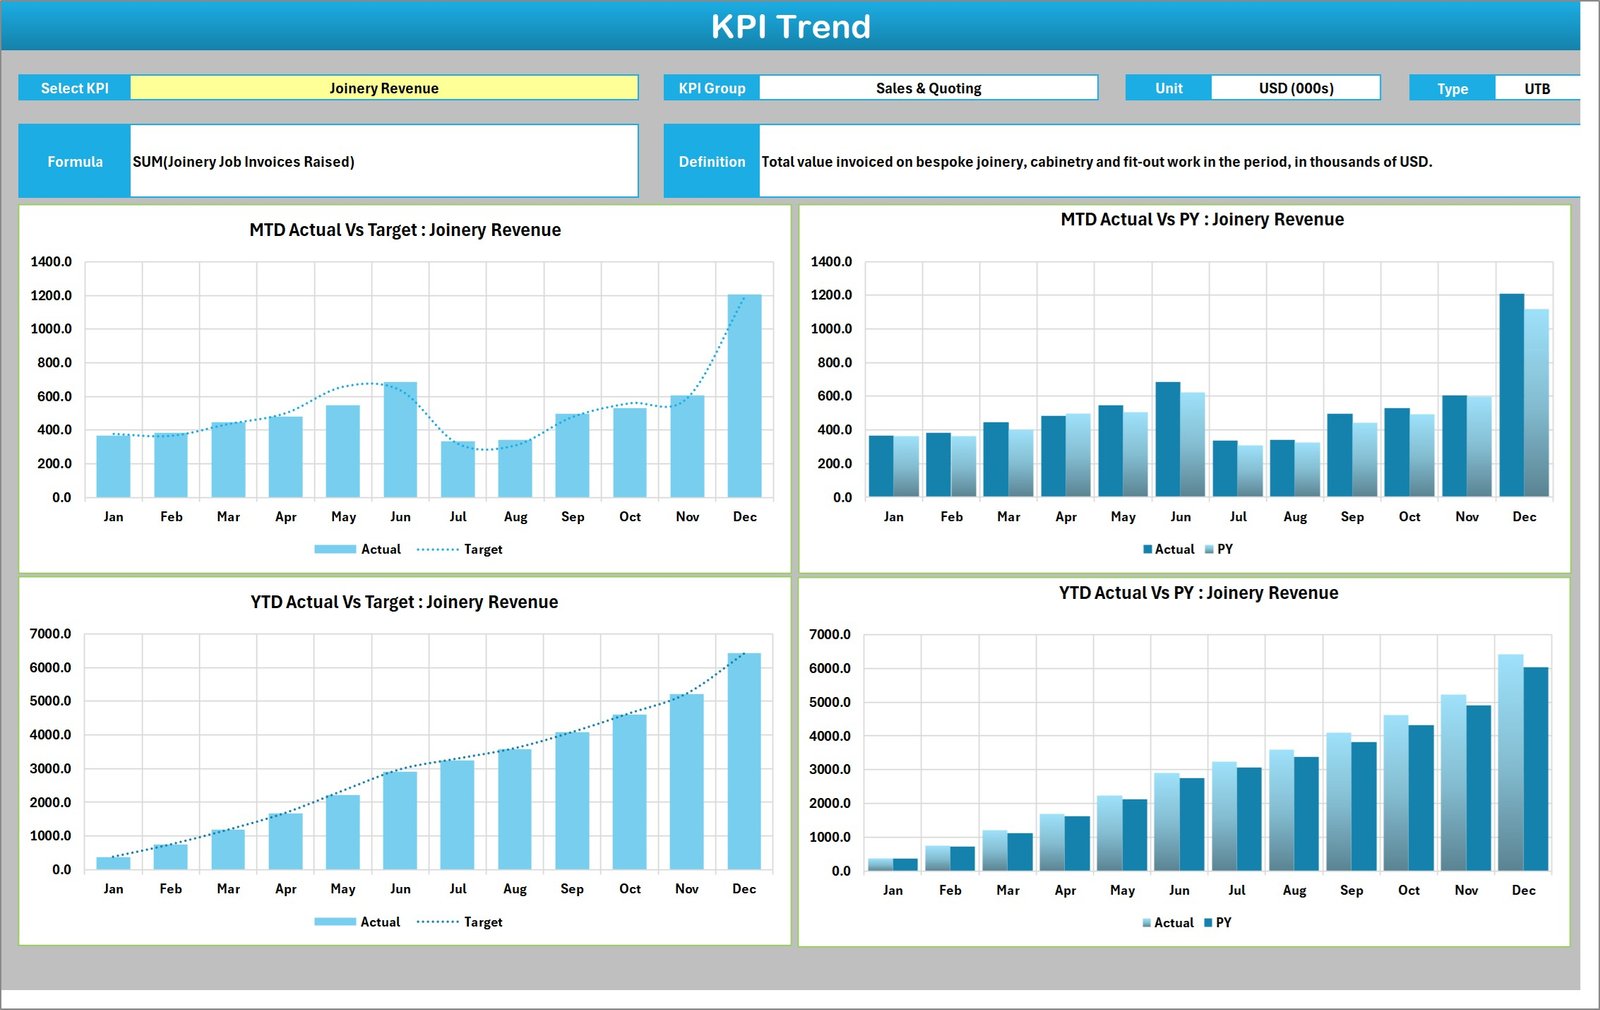
One KPI at a time, chosen from a dropdown. The header repeats that KPI’s group, unit and direction, and the sheet prints its formula and definition in full – so a reader who has never seen the workbook can tell exactly what “Joinery Revenue” means before reading the chart. Four charts follow: MTD Actual Vs Target, MTD Actual Vs PY, YTD Actual Vs Target and YTD Actual Vs PY, each twelve months wide.
KPI Definition
The dictionary the rest of the workbook reads. Eight columns per KPI: Group, Name, Unit, Formula, Definition, Type (UTB or LTB), YTD Basis (Sum or Average) and a Check column that turns red if two KPIs share a name. Rename a KPI here and the Scorecard, Trend and Analysis pages rename with it, because every page looks a KPI up by name.

The other five are Home (navigation), Input Data (the only place you type – one numbered block per KPI with twelve rows of MTD and YTD Actual, Target and PY), Color Settings (RAG bands, report title, reporting year), Read Me (nine short how-it-works sections) and Get More Templates.
Carpentry Workshop KPI Scorecard in Excel vs. a Google Sheets Scorecard vs. Paid Job-Management SaaS
| Feature | Carpentry Workshop KPI Scorecard in Excel | Google Sheets scorecard | Buildertrend / Jobber / simPRO |
|---|---|---|---|
| Cost | $9.99 one-time ✅ | $8-14 one-time | $99-399 / month |
| Platform | Excel 2016+, Microsoft 365, Excel for Mac | Browser only, Google account required | Browser + mobile app |
| Setup time | About 15 minutes ✅ | About 15 minutes | 2-6 weeks onboarding |
| Works offline in the workshop | Yes ✅ | No | Partial (mobile cache) |
| Real-time team collaboration | Via OneDrive / SharePoint co-authoring | Yes, native ✅ | Yes ✅ |
| Rename or replace the KPIs yourself | Yes, on one sheet ✅ | Yes | Vendor-defined metric set |
| MTD and YTD vs Target and PY | Yes, both, all 12 months ✅ | Yes | Usually an add-on report module |
| Macros or IT approval needed | None – 100% formulas ✅ | None | Vendor security review |
| Year-1 cost at 5 users | $9.99 ✅ | $8-14 | $5,900-23,900 |
For a joinery shop that wants a board-ready monthly scorecard without a job-management subscription, the Carpentry Workshop KPI Scorecard in Excel sits in the sweet spot.
Who Should Use This Template
Perfect for:
- Owners and managers of bespoke joinery, cabinet-making and shopfitting workshops with roughly 3-50 bench staff
- Production supervisors who already pull monthly figures from a job book or accounts package and need to present them
- Contract carpentry firms reporting on-time delivery and rework rates to a main contractor
- Anyone who wants a clean monthly KPI pack in Excel without buying a job-management platform
Not a fit if:
- You expect the workbook to read your job list and calculate the KPIs. It does not – you type the finished monthly figures in.
- You need live job costing, scheduling, timesheets, quoting or invoicing. This is reporting, not operations.
- You need more than 20 KPIs, or weekly or daily reporting. The grain here is monthly.
- You want slicers over a transaction table – that is the Excel Dashboard line, not the scorecard line.
Real-World Use Cases
Daniel runs a 14-bench bespoke joinery shop. On the first Monday of the month he types his figures into Input Data from the job book, opens the Scorecard and prints one page for the toolbox meeting. Last month it showed Rework Hours Share red at 7.0% against a 6.2% target – a number the shop had been arguing about for a year without ever measuring it.
Priya is production manager for a shopfitting contractor. Her main contractor asks for on-time delivery and first-pass quality every quarter. She switches the header to YTD, screenshots the two tiles and the KPI Trend page for On-Time Job Delivery, and the quarterly report is done in five minutes instead of an afternoon rebuilding a pivot table.
Marcus owns two small cabinet workshops. He keeps one copy of the workbook per site with an identical KPI list, then compares the two KPI Analysis pages side by side. The Achievement by KPI Group table makes it obvious at a glance that one site’s Cost & Materials group is dragging while its Workshop Output group is fine.
Advantages of the Carpentry Workshop KPI Scorecard in Excel
- It costs a one-off $9.99 instead of $99-399 a month. At five users, year one is $9.99 against $5,900 or more for a job-management platform – and you are not renting your own reporting.
- It is honest about direction. Plenty of home-made scorecards colour every metric as if higher were better. Getting Rework Hours Share, Timber Waste Rate and Timber Cost per Unit the right way round is the difference between a scorecard that helps and one that flatters you.
- Nothing to enable. No macros means no security warning, no blocked file from a corporate download, and no “this workbook contains macros” conversation with a client’s IT department.
- Renaming is safe. Because every page looks a KPI up by name from the KPI Definition sheet, you can turn this into a metalwork, upholstery or shopfitting scorecard without touching a formula.
- The definitions travel with the numbers. The KPI Trend page prints each KPI’s formula and definition, which quietly ends the “what exactly counts as on-time?” debate.
Opportunities for Improvement
Three honest limitations, so you buy it knowing what it is.
It does not calculate YTD for you. You type both the MTD and the YTD figures. That is a deliberate design choice the Read Me explains – the right roll-up differs by KPI, a sum for volumes and an average for rates – but it does mean twice as many cells to fill. If your source system already reports YTD this is a copy-paste; if it does not, budget for the arithmetic.
It has no data layer. There is no job table, no timesheet import and no connection to an accounts package. This is a presentation workbook, and if your figures are wrong going in, they will be beautifully colour-coded going out.
Monthly grain only, ten tiles at a time. The Scorecard shows ten KPIs per screen and the reporting period is a calendar month. A shop that wants a weekly bench-hours review will need a second tool alongside it.
A small cosmetic note: both callout bubbles on the Color Settings sheet read “Change these number as per your requirements” rather than “numbers”. It affects no calculation – it is a label typo you can fix in ten seconds if it bothers you.
Best Practices
- Set Color Settings first. Report title, reporting year, and your own Amber and Red thresholds. Ten percent is a sensible default, but a safety or compliance KPI usually deserves a tighter band than a revenue KPI.
- Write the definitions before you write the numbers. Fill the Formula and Definition columns on KPI Definition properly. Six months from now, that column is the only thing that will tell you what you actually measured.
- Keep every KPI name unique. Every page looks a KPI up by name, so two KPIs sharing a name get added together. The Check column flags this – do not ignore it.
- Get the direction right before anything else. Set Type to UTB or LTB on every row. This is the single field most likely to make an otherwise correct scorecard tell you the opposite of the truth.
- Leave future months blank. A KPI with a blank or zero comparison value reads n/a rather than inventing a variance, so a part-filled year still reports correctly.
- Present from KPI Analysis, investigate from KPI Trend. The Bottom 5 table tells you where to look; the Trend page tells you whether it is a bad month or a bad year.
If you plan to move the RAG bands or add rules of your own, Microsoft’s own documentation on using conditional formatting to highlight information is a good ten-minute read before you start customising.
Explore Relevant Templates
The same scorecard exists for other trades, each with its own KPI list rather than the same ten metrics rebadged: Masonry Contractor KPI Scorecard in Excel, Welding Shop KPI Scorecard in Excel, Painting Contractor KPI Scorecard in Excel, Roofing Contractor KPI Scorecard in Excel and Flooring Installation KPI Scorecard in Excel.
If ten KPIs is not enough, the KPI Dashboard line is the bigger sibling – see the Electrical Contractor KPI Dashboard in Excel for what that looks like. For woodworking at manufacturing scale there is a Wood & Furniture Manufacturing KPI Dashboard in Power BI, and the whole family lives in the KPI Dashboard and Scorecard category.
Also available as: a Google Sheets edition of this carpentry scorecard is in preparation and will be listed alongside the Excel one.
Frequently Asked Questions
What KPIs does the Carpentry Workshop KPI Scorecard in Excel track?
Ten: Joinery Revenue, Quote Win Rate, Cabinet Units Produced, Bench Hours Utilisation, On-Time Job Delivery, First-Pass Quality Rate, Rework Hours Share, Timber Waste Rate, Timber Cost per Unit and Toolbox Talk Compliance. Every one of them can be renamed on the KPI Definition sheet.
Does it calculate the KPIs from my job data?
No. The Carpentry Workshop KPI Scorecard in Excel is a reporting layer – you type the finished monthly MTD and YTD figures on the Input Data sheet. It then calculates variance, achievement, traffic lights, group roll-ups and trends from those figures. It does not read a job list or a timesheet.
Can I add more than ten KPIs?
Yes, up to twenty. Add a row on KPI Definition, fill the matching numbered block on Input Data, and use the KPI 1-10 / 11-20 picker in the Scorecard header. No formulas need editing, because the blocks for all twenty slots are pre-built.
How long does setup take?
About 15 minutes to rename the KPIs and set the title, reporting year and RAG bands – plus however long it takes to gather twelve months of history. If you only have part of the year, leave the rest blank; the scorecard reads n/a rather than guessing a variance.
Do I need macros, Power Query or an add-in?
None of them. The Carpentry Workshop KPI Scorecard in Excel is 100% formulas, conditional formatting, camera pictures and sparklines. It opens on Excel 2016 and later, on Microsoft 365 and on Excel for Mac, with no security prompt.
How does this compare to Buildertrend or Jobber?
Those are job-management platforms costing $99-399 a month that run quoting, scheduling and invoicing. This is a $9.99 one-time monthly KPI scorecard. If you already have a job system and only need a board-ready KPI pack, this replaces the reporting job, not the operations job.
What is the difference between the KPI Scorecard and the KPI Dashboard?
The Carpentry Workshop KPI Scorecard in Excel is the month-picker tile wall – ten KPIs, traffic lights, one trend page, figures you type in. The KPI Dashboard line is larger, usually 14-15 KPIs with a wider analysis page. Both are different again from the analytical Excel Dashboard line, which uses pivots and slicers over a transaction table.
About the Author
Built by PK – Microsoft Certified Professional with 15+ years of Excel, Google Sheets and Power BI experience. Founder of NextGenTemplates, reaching 300K+ subscribers across YouTube channels. Every template is hand-built and tested before release.
Conclusion
A carpentry workshop does not need a $300-a-month platform to answer four questions each month: are we selling, are we producing, are we producing it right, and are we making money on the timber. The Carpentry Workshop KPI Scorecard in Excel answers all four on one page, in a file you own outright and can rename to fit any bench trade.
👉 Click here to Purchase the Carpentry Workshop KPI Scorecard in Excel
Instant download · One-time payment · No subscription · Lifetime access
🎥 For step-by-step Excel video tutorials, visit Youtube.com/@PK-AnExcelExpert.
Last updated: August 2026