Manufacturing operations run on tight schedules, fixed deadlines, and coordinated activities. Therefore, missing a maintenance date, safety drill, audit, production
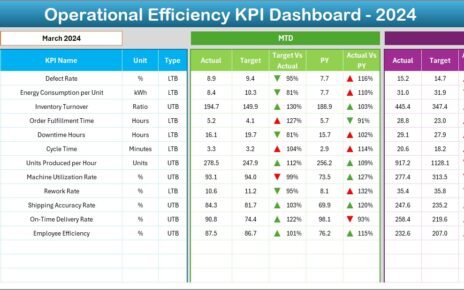
Operational efficiency is the backbone of any successful business. Organizations constantly strive to optimize their operations, reduce waste, and enhance
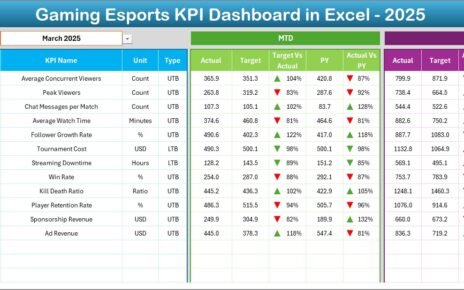
The esports industry grows faster than ever before. Teams, tournament organizers, gaming platforms, sponsors, and analysts now rely heavily on