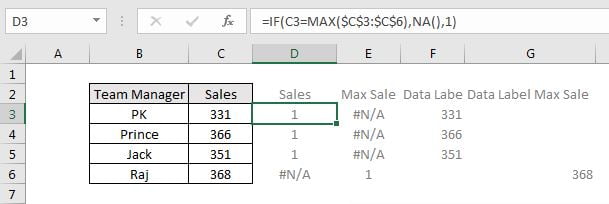
Efficient production planning is the backbone of any manufacturing or operations-driven business. Without proper tracking, resource allocation, and performance monitoring,
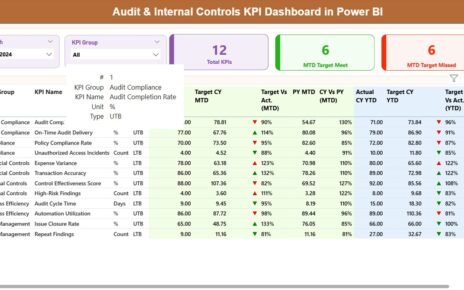
In today’s dynamic business environment, organizations face increasing pressure to maintain robust internal controls and ensure compliance with regulatory requirements.
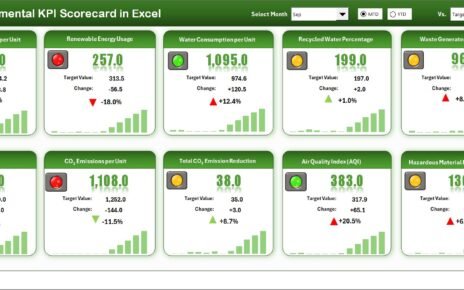
In the modern era of sustainability and corporate responsibility, every organization strives to reduce its environmental footprint while improving operational