Managing retail projects demands precision, visibility, and timely execution. From store launches and promotional campaigns to inventory audits and seasonal
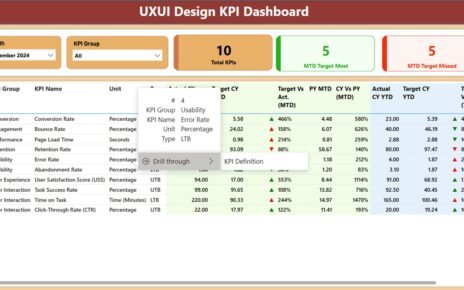
In today’s fast-paced digital world, user experience (UX) and user interface (UI) design play a crucial role in determining the
In the fast-paced world of media, data drives every decision. Whether it’s tracking audience engagement, ad revenue, or content production,