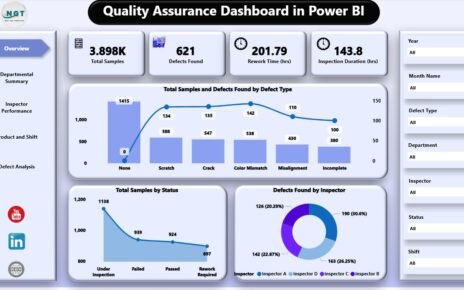
Home>Blogs>Charts and Visualization>Forecast Vs Actual Chart with Safe Zone Range in Excel>Forecast Vs Actual Chart -2
Forecast Vs Actual Chart -2
31
Jul 2019
2228Comments Off on Forecast Vs Actual Chart -2
PK
Meet PK, the founder of PK-AnExcelExpert.com! With over 15 years of experience in Data Visualization, Excel Automation, and dashboard creation. PK is a Microsoft Certified Professional who has a passion for all things in Excel. PK loves to explore new and innovative ways to use Excel and is always eager to share his knowledge with others. With an eye for detail and a commitment to excellence, PK has become a go-to expert in the world of Excel. Whether you're looking to create stunning visualizations or streamline your workflow with automation, PK has the skills and expertise to help you succeed. Join the many satisfied clients who have benefited from PK's services and see how he can take your Excel skills to the next level!
https://www.pk-anexcelexpert.com
Related Articles
Pet Care Services KPI Dashboard in Power BI
The pet care industry continues to grow rapidly. Pet owners now expect high-quality grooming, boarding, daycare, training, and veterinary services.
Blockchain & Cryptocurrency KPI Dashboard in Excel
The blockchain and cryptocurrency world evolves rapidly, and staying updated with key metrics is crucial for success. Managing large volumes
Finance Customer Service Remote Work Calendar in Excel
Remote work has become an essential part of business operations across all industries, and the finance sector is no exception.


