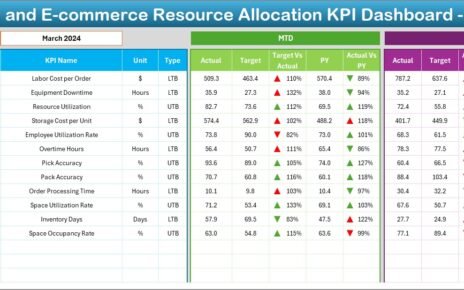
In the fast-paced world of retail and e-commerce, allocating resources wisely makes the difference between steady growth and missed opportunities.
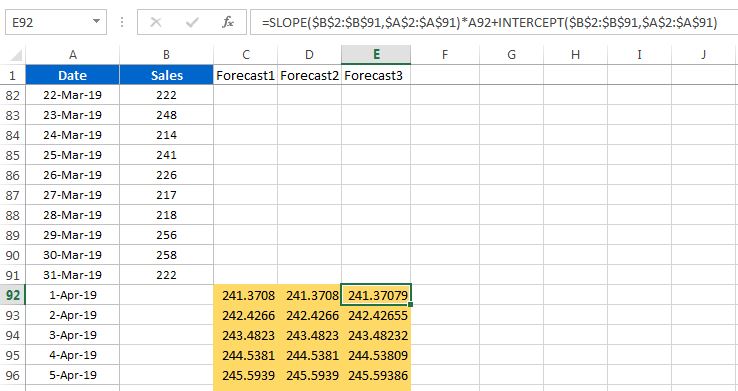
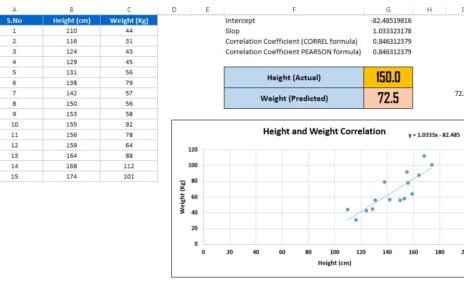
In this article, we have explained how to calculate the Correlation Coefficient in Microsoft Excel. We have explained it using
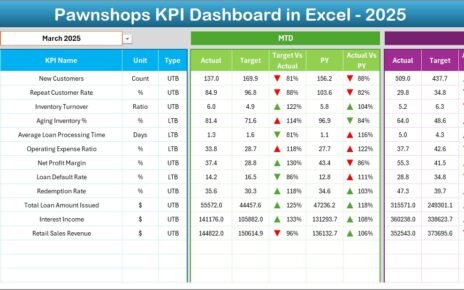
Running a pawnshop requires sharp decision-making. You manage loans, inventory, customer transactions, redemptions, defaults, and profit margins every single day.