Road and highway construction projects require continuous monitoring, quick decision-making, and tight control over performance. You manage project timelines, labor
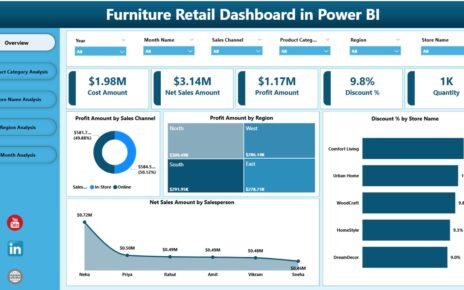
Furniture retail is a competitive and data-driven business. Every day, retailers track sales, discounts, profits, stores, regions, and product categories.
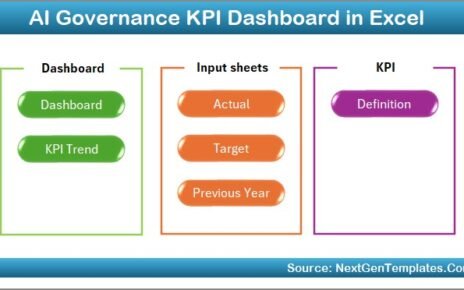
Artificial Intelligence continues to reshape how organizations operate, decide, and compete. However, as AI adoption increases, governance, ethics, compliance, and