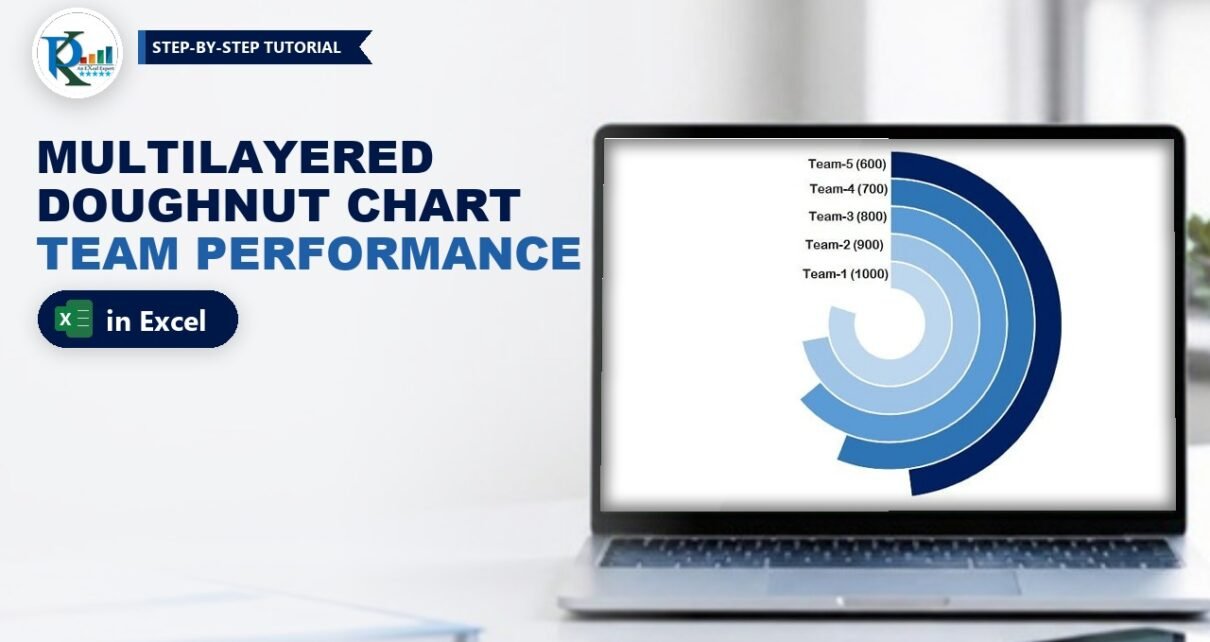
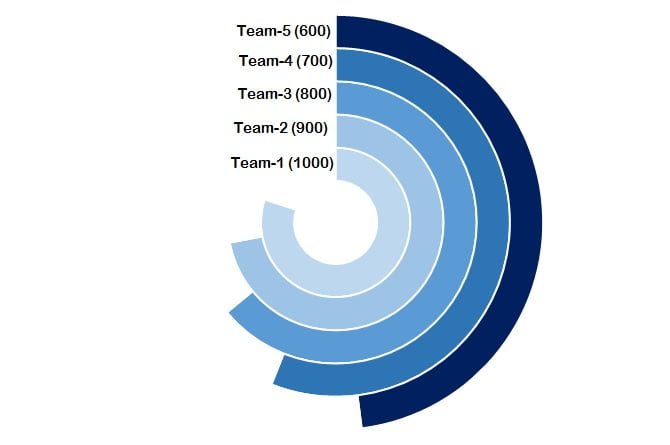
A multilayered doughnut chart in Excel stacks one ring per team, so you can compare five or six teams at a glance in a dashboard or presentation. This is Part 2 of the series. In Multilayered Doughnut Chart Part 1 you built the metric-level version; here you build the team-level performance chart. Each team gets its own ring, the ring length shows its sales, and a linked label like Team-1 (1200) sits at the start of every ring. It takes one helper formula, a doughnut chart with Switch Row/Column, some fill formatting and five linked text boxes.
Watch the Video Tutorial
In the video PK changes a few sales values to show the rings react, then rebuilds the chart on a new sheet: the MAX helper, the doughnut with Switch Row/Column, the No fill trick, the blue shades and the linked text box labels.
What You Will Build
- Five concentric rings, one per team, built from a single doughnut chart.
- Ring lengths that scale automatically from one helper formula based on the highest sales value.
- Open rings: the unused part of each ring is invisible, so only the performance arc shows.
- A blue colour scale from light on the inside to dark navy on the outside.
- Dynamic labels such as Team-1 (1200), linked to cells so they update with the data.
Part 1 – Set Up the Data
Step 1: Enter the team sales
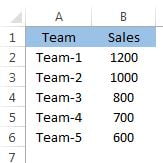
Type Team and Sales in A1:B1, then the five teams and their sales in A2:B6. PK’s example uses Team-1 to Team-5 with sales of 1200, 1000, 800, 700 and 600.
Step 2: Add the support column
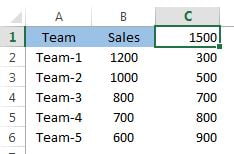
Column C holds the “rest” of each ring, the part that will be made invisible later. Enter:
C1  =MAX(B2:B6)*1.25
C2  =$C$1-B2
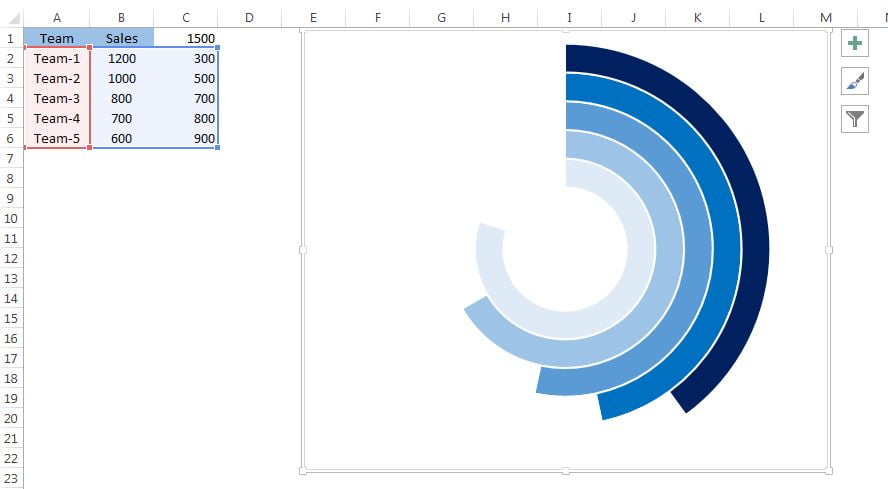
Fill C2 down to C6. With a top value of 1200, C1 returns 1500, and C2:C6 return 300, 500, 700, 800 and 900.
How the formula works
- Every ring in a doughnut chart is a full circle of its own series total. Because Sales plus Rest always equals C1, every ring has the same total, so ring lengths can be compared fairly.
MAX(B2:B6)*1.25makes the total 25 percent bigger than the best team. The top team therefore fills 1200 / 1500 = 80 percent of its ring, and there is always a gap at the end of every ring.$C$1-B2is the leftover for each team. C1 is locked with dollar signs so it stays fixed as you fill down.- Change any sales value and both the MAX and the leftovers recalculate, so the chart redraws itself.
Part 2 – Build the Multilayered Doughnut Chart
Step 3: Insert a doughnut chart
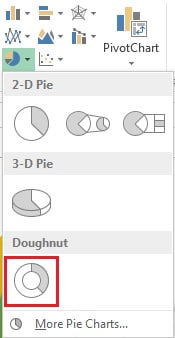
Select A2:C6 and go to Insert › Charts › Doughnut.
Step 4: Switch Row/Column
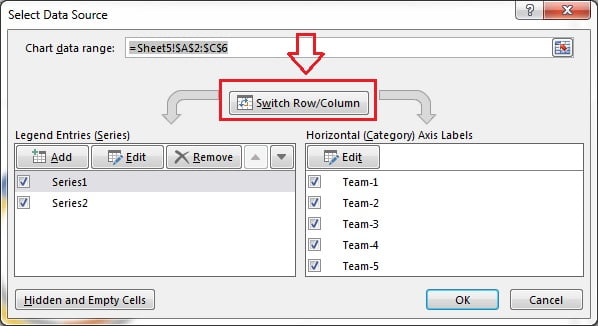
Excel first draws one ring with five slices. Right-click the doughnut, choose Select Data and click Switch Row/Column, then OK. Now every team is its own series, which means its own ring, and each ring has two slices: Sales and Rest.
Step 5: Tidy the chart and set the hole size
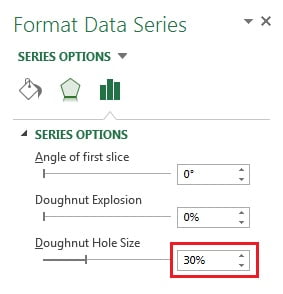
Use the + button to remove the chart title and the legend. Right-click a ring, choose Format Data Series and set the Doughnut Hole Size to 30 percent. In the Format tab give the chart area No fill and No outline, and untick Gridlines in the View tab so the chart floats on a clean sheet.
Step 6: Hide the Rest slices
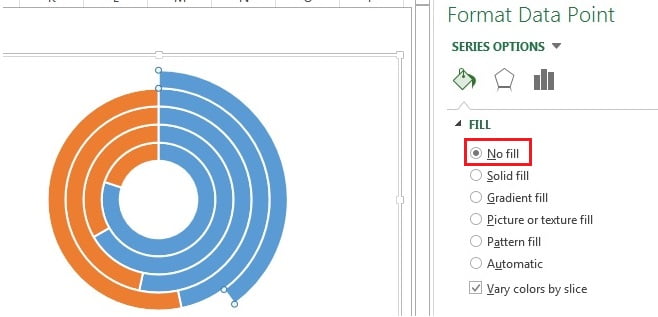
Click the orange slice of the first ring, then click it again so only that one slice is selected. In Fill & Line choose No fill. Repeat for the orange slice of every other ring. Only the sales arcs remain visible.
Step 7: Colour the rings
Select the blue slice of each ring the same way and give it a Solid fill. PK uses a scale of blues: dark navy for the outer ring and lighter shades towards the centre.
Part 3 – Add Dynamic Labels
Step 8: Build the label text
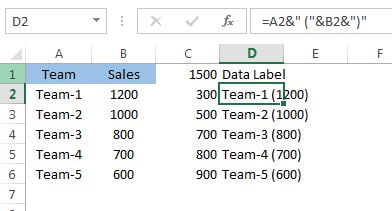
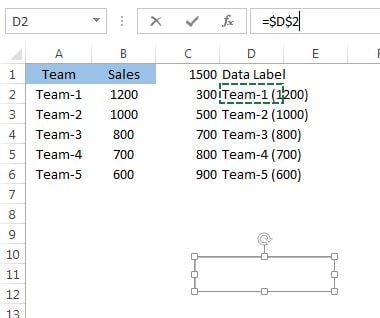
Type Data Label in D1 and enter this formula in D2, then fill it down to D6:
=A2&" ("&B2&")"The ampersand joins the team name, a space and an opening bracket, the sales value and a closing bracket, so D2 shows Team-1 (1200).
Step 9: Link a text box to the cell
Go to Insert › Text Box and draw a small box. With the text box selected, click in the formula bar, type =$D$2 and press Enter. The box now shows the label from D2 and follows it whenever the data changes.
Step 10: Format, copy and place the labels
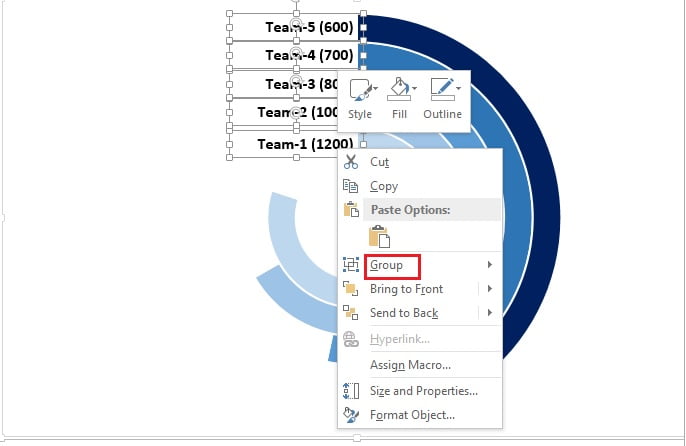
Format the text box with right alignment, Shape Fill › No fill, Shape Outline › No outline and a bold font. Team-1 is the smallest, innermost ring, so place this box at the start of that ring. Copy it four times, link the copies to D3, D4, D5 and D6, and stack them so each label sits at the start of its own ring. Select all five and use Format › Align › Align Right to line them up, then group them so they move together.
Now type a new sales value, for example 350 for Team-1, and watch the ring and the label update together.
Common Errors and Fixes
This section and the Tips below are additions to PK’s original method.
You get one ring with five slices
The series are still in rows. Open Select Data and click Switch Row/Column.
A whole ring disappears when you set No fill
You selected the entire series. Click once to select the ring, then click the orange slice again so only that point is selected before you change the fill.
The longest ring closes into a full circle
C1 is too close to the top value, or it is a fixed number that no longer covers the data. Keep =MAX(B2:B6)*1.25 so there is always a gap.
Labels do not update
The text box holds typed text instead of a link. Select it and enter the cell reference, such as =$D$2, in the formula bar.
Tips
- To show a sixth team, add it to row 7, extend the formulas to row 7, add it to the chart range and link one more text box to D7.
- Change 1.25 to 1.5 for shorter, more open rings, or to 1.1 for nearly full rings. The top team always fills 1 divided by that number.
- Sort the teams by sales if you want the rings to step down neatly from outside to inside.
- Group the chart and the text boxes together before copying the chart into a dashboard so nothing shifts.
- Microsoft’s guide Create a chart from start to finish covers Select Data and chart formatting basics.
Want It Ready-Made?
Skip the formatting and start from the finished file: get Multilayered Doughnut Chart : Part-2 from NextGenTemplates.com, or browse more Excel charts and visualization templates. If you want to build charts like this into full dashboards, the course Excel Pivot Tables and Dashboards on the NextGenTemplates Academy covers charts, infographics and dashboard design step by step.
Related Tutorials
- Multilayered Doughnut Chart Part 1: Metric-Level Performance
- 5 Layered Advanced Doughnut Chart in Excel
- Stylish Doughnut Charts in Excel
- Double Doughnut Chart in Excel
- Half Circle KPI Charts in Excel Using Doughnut Charts
Frequently Asked Questions
How do I make a multilayered doughnut chart in Excel?
Put each team’s sales and a Rest value in one row, insert a doughnut chart and use Switch Row/Column so every row becomes its own ring. Then set the Rest slices to No fill so only the sales arcs show.
Why multiply the maximum by 1.25?
It sets the total of every ring to 125 percent of the top sales value, so even the best team fills only 80 percent of its ring and the rings stay open and easy to compare.
What does Switch Row/Column do in a doughnut chart?
It swaps series and categories. With teams as series, each team gets its own ring instead of being a slice of a single ring.
How do I link a text box to a cell?
Select the text box, click in the formula bar, type an equals sign and the cell reference, for example =$D$2, and press Enter.
How many teams can this chart show?
Five or six rings read well. More rings get thin and the labels start to crowd.
Where is Part 1?
Part 1 builds the metric-level version of the multilayered doughnut chart. You can find it on this site as Multilayered Doughnut Chart Part 1, linked in the Related Tutorials section.
About the Author
PK is a Microsoft Excel expert and trainer and the founder of PK: An Excel Expert and NextGenTemplates.com. He has been teaching Excel, Power Query and Power BI since 2016 on his YouTube channel.
Conclusion
A multilayered doughnut chart in Excel turns a plain team sales table into a compact, eye-catching visual. One MAX formula gives every ring the same total, Switch Row/Column gives each team its own ring, No fill hides the leftovers, and linked text boxes keep the labels live. Change a number and the whole chart updates, ready for your next dashboard or presentation.