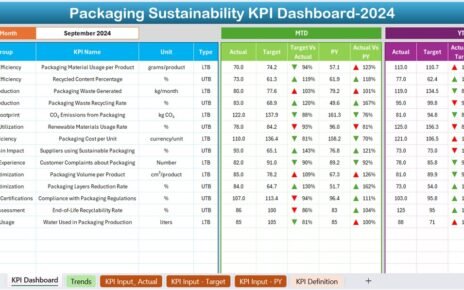
In today’s environmentally conscious world, businesses are making great efforts to reduce their environmental footprint. Packaging plays a vital role
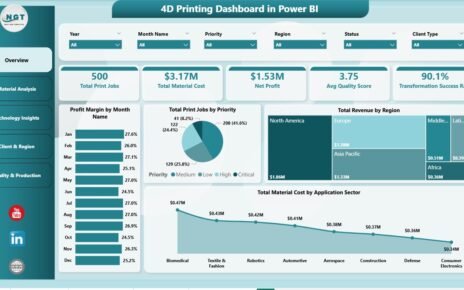
4D Printing Dashboard in Power BI is a professionally designed, ready-to-use analytics template that empowers manufacturing professionals to track, analyze,
In today’s digital-first workplace, managing remote work schedules and events efficiently is no longer optional—it’s essential. Whether you're an IT