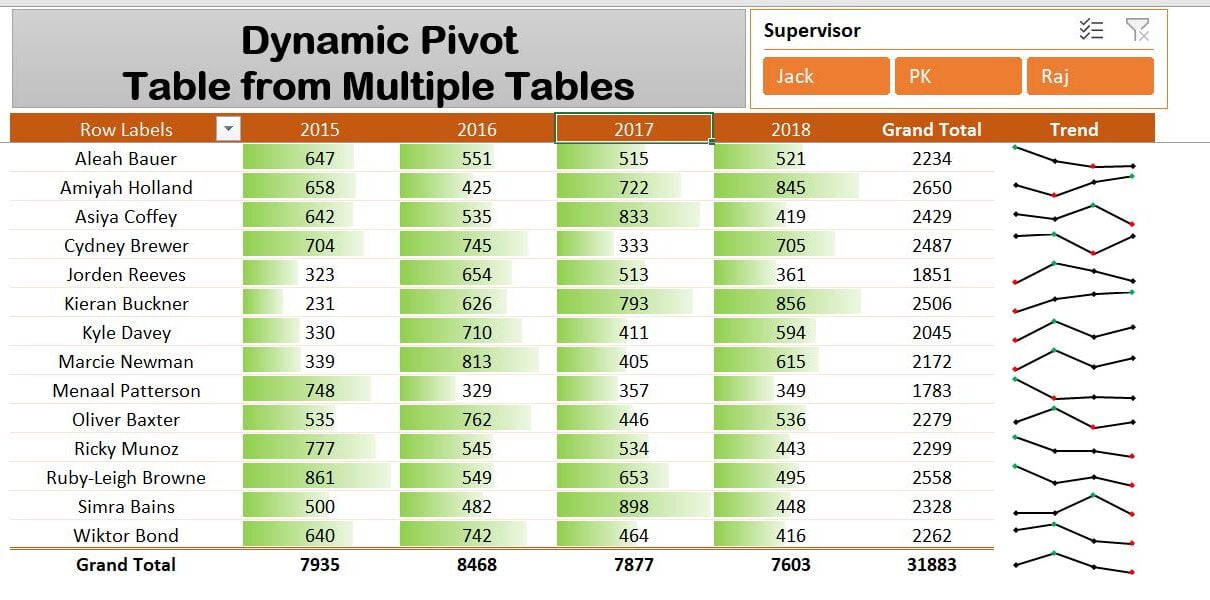
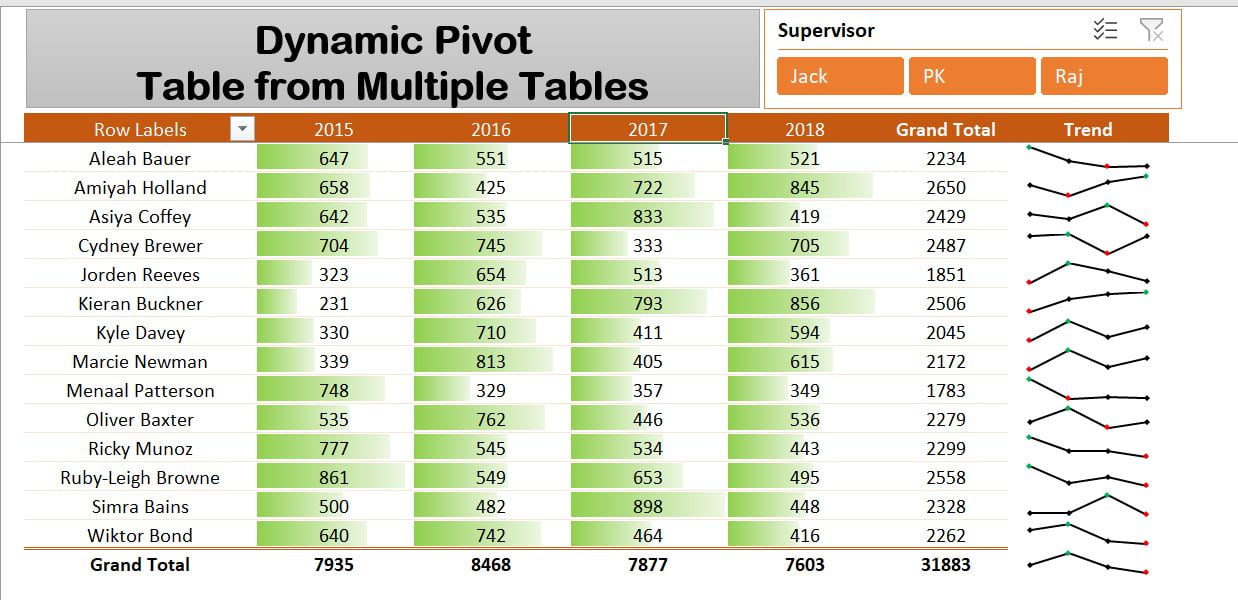
Power Query consolidates the tables used in this Excel PivotTable example: four yearly Sales Tables and an Employee Master containing supervisor and employee names. The final report includes slicers and sparklines. The original screenshots, workbook and video show the input tables and finished report.
What data does the example use?
| Input or output | Purpose in this example |
|---|---|
| Four yearly Sales Tables | Provide the sales records to consolidate. |
| Employee Master | Provides supervisor and employee names. |
| Final PivotTable | Presents the consolidated report with slicers and sparklines. |
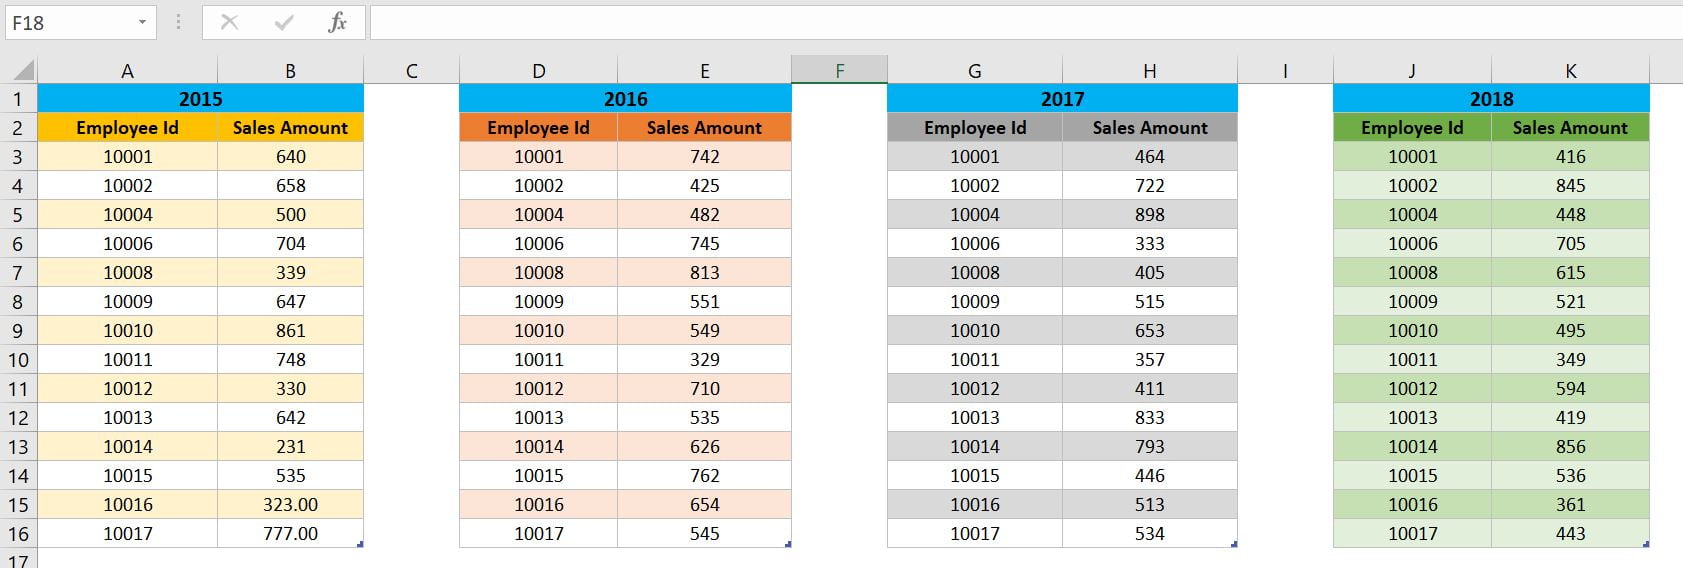
In this article, we have created a dynamic Pivot Table with Multiple Tables using Power Query. We have taken 4 different yearly Sales Table as given in below image-
Dynamic Pivot Table with Multiple Tables using Power Query
Multiple Sales Table
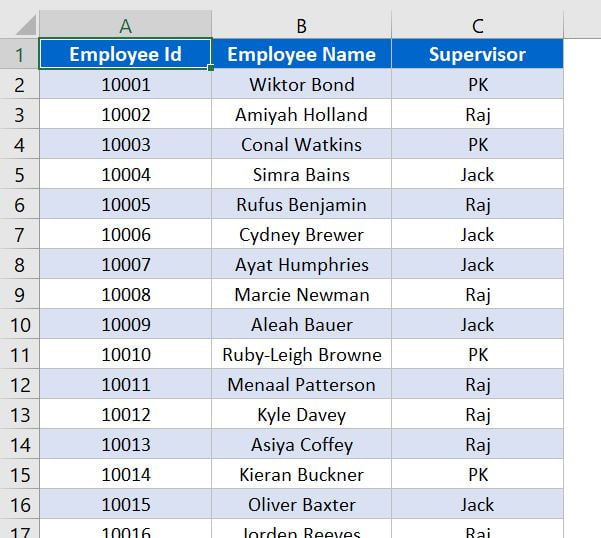
We have created an Employee Master Table to display the Supervisor and Employee Name data.
We have used Power Query to consolidate all above table and created below given final Pivot Table Report with Slicers and Sparklines.
Visit our YouTube channel to learn step-by-step video tutorials