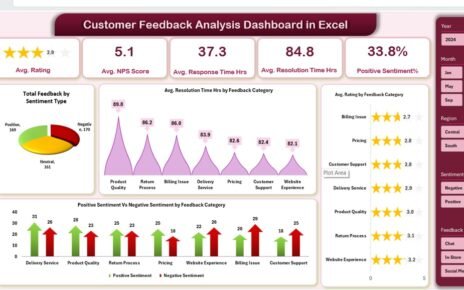
Home>Blogs>Dashboard>Comparative Analysis Dashboard in Excel>Comparative Analysis Dashboard in Excel-6
Comparative Analysis Dashboard in Excel-6
20
Jun 2021
138Comments Off on Comparative Analysis Dashboard in Excel-6
PK
Meet PK, the founder of PK-AnExcelExpert.com! With over 15 years of experience in Data Visualization, Excel Automation, and dashboard creation. PK is a Microsoft Certified Professional who has a passion for all things in Excel. PK loves to explore new and innovative ways to use Excel and is always eager to share his knowledge with others. With an eye for detail and a commitment to excellence, PK has become a go-to expert in the world of Excel. Whether you're looking to create stunning visualizations or streamline your workflow with automation, PK has the skills and expertise to help you succeed. Join the many satisfied clients who have benefited from PK's services and see how he can take your Excel skills to the next level!
https://www.pk-anexcelexpert.com
Related Articles
Supply Chain and Logistics Process Improvement KPI Dashboard in Excel
In today’s fast-moving business world, a smooth and efficient supply chain is no longer a luxury—it’s a necessity. Companies rely
Energy & Utility Dashboard in Excel
In today's fast-paced energy and utility sectors, managing operational data efficiently can significantly impact the overall performance of facilities. An
Technology Logistics Supply Chain Resilience Calendar in Excel
In today’s fast-paced global economy, logistics teams face unprecedented challenges. Consequently, companies need robust tools to track critical dates, coordinate