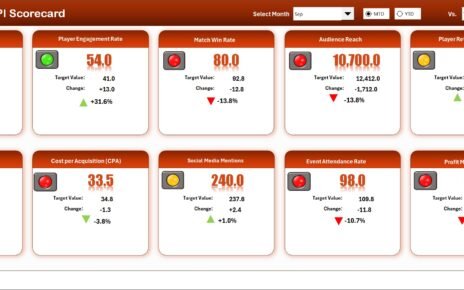
E-sports KPI Scorecard — Ready-to-Use Template The E-sports KPI Scorecard is a professional, ready-to-use template that helps teams, organizations, and
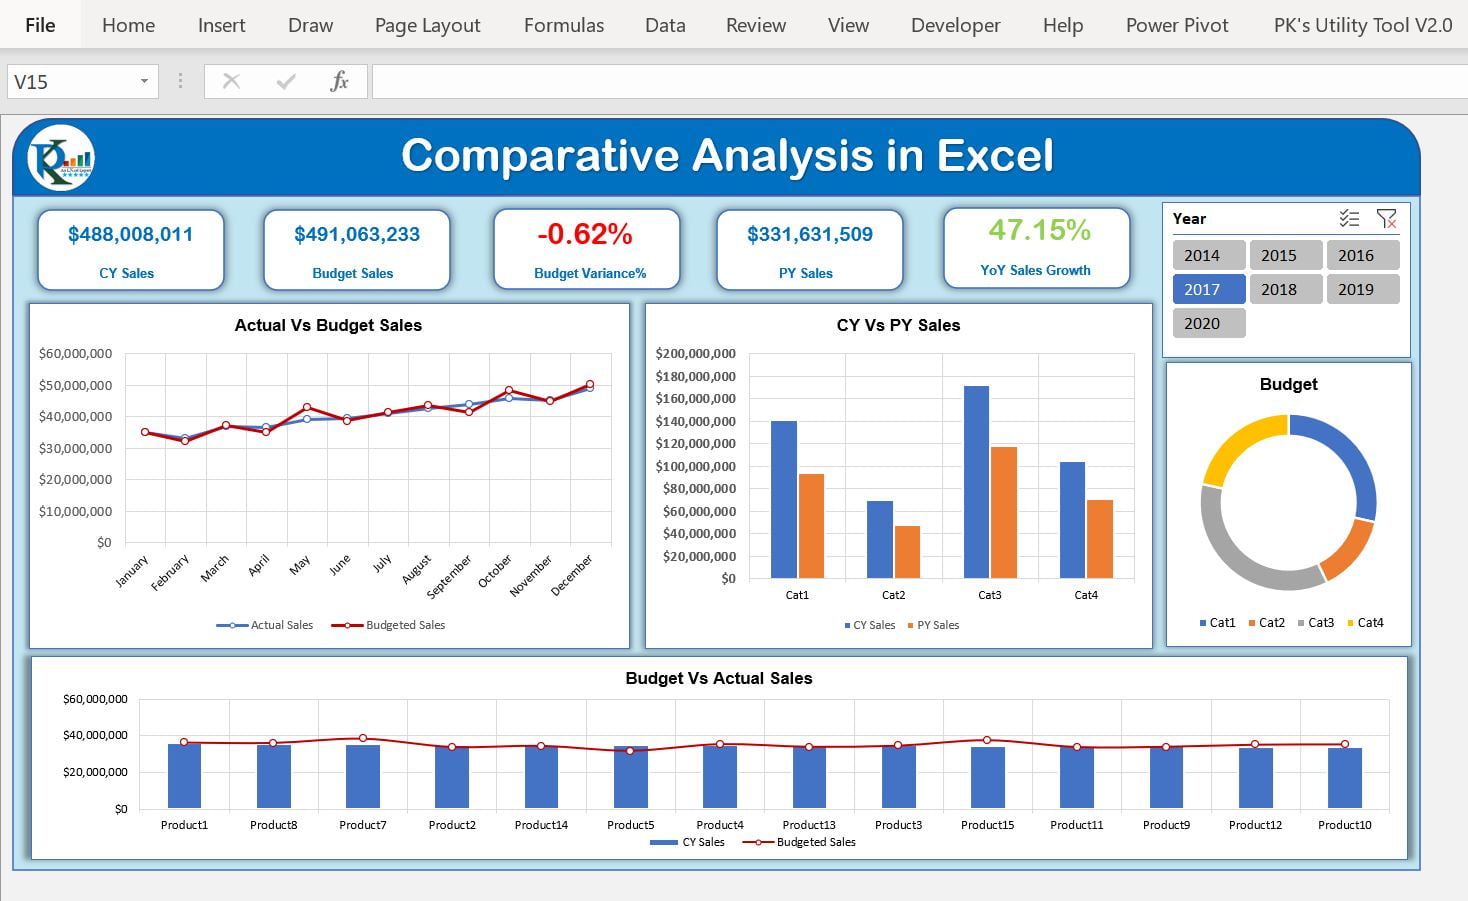
Data analysis is integral to understanding and improving business processes. Among the plethora of data analysis tools available, Excel charts
Make Your Excel Data Invisible In this article, we will explain you how to Make Your Excel Data Invisible. Have