Home>Blogs>Charts and Visualization>Cross Filter Functionality in Excel Chart>Cross Filter in Excel Chart -2
Cross Filter in Excel Chart -2
05
Jul 2021
113Comments Off on Cross Filter in Excel Chart -2
PK
Meet PK, the founder of PK-AnExcelExpert.com! With over 15 years of experience in Data Visualization, Excel Automation, and dashboard creation. PK is a Microsoft Certified Professional who has a passion for all things in Excel. PK loves to explore new and innovative ways to use Excel and is always eager to share his knowledge with others. With an eye for detail and a commitment to excellence, PK has become a go-to expert in the world of Excel. Whether you're looking to create stunning visualizations or streamline your workflow with automation, PK has the skills and expertise to help you succeed. Join the many satisfied clients who have benefited from PK's services and see how he can take your Excel skills to the next level!
https://www.pk-anexcelexpert.com
Related Articles
University Department KPI Dashboard in Excel
Universities and academic departments often juggle a variety of tasks and responsibilities, making it challenging to assess performance and make
Dairy Products Processing Plant Dashboard in Excel
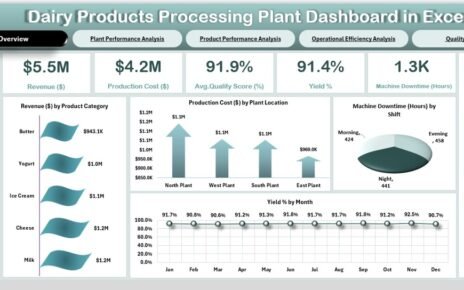
The dairy industry runs on precision, quality, and efficiency. However, managing a dairy processing plant involves multiple moving parts. You
Accounts Payable KPI Dashboard in Power BI
Managing Accounts Payable KPI Dashboard efficiently plays a critical role in cash flow control, vendor relationships, and overall financial health.


