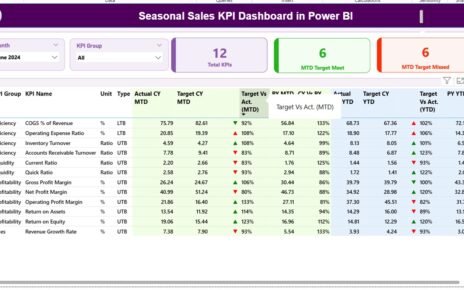
Seasonal sales play a vital role in every business that experiences demand fluctuations throughout the year. Whether it’s holiday shopping,
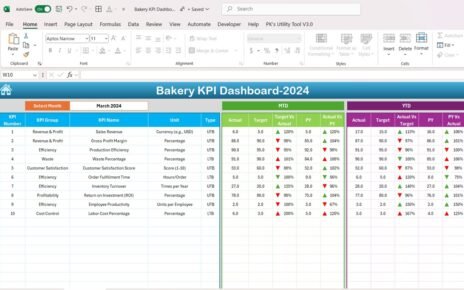
Running a successful bakery involves managing various aspects, from production efficiency to customer satisfaction. Tracking the right Key Performance Indicators
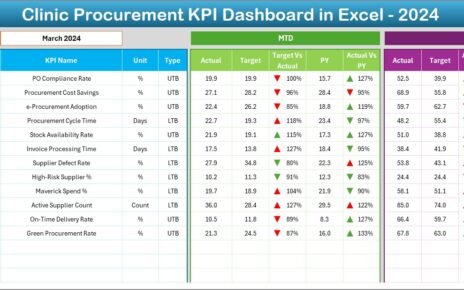
Managing procurement in a clinic is never simple. Clinics must balance cost control, supplier performance, compliance, and uninterrupted medical supply