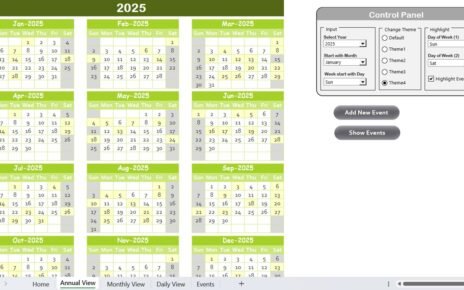
Home>Blogs>Charts and Visualization>Conditional Formatting in a Lollipop Chart in Excel>CF in LP Chart-2
CF in LP Chart-2
23
Feb 2019
140Comments Off on CF in LP Chart-2
PK
Meet PK, the founder of PK-AnExcelExpert.com! With over 15 years of experience in Data Visualization, Excel Automation, and dashboard creation. PK is a Microsoft Certified Professional who has a passion for all things in Excel. PK loves to explore new and innovative ways to use Excel and is always eager to share his knowledge with others. With an eye for detail and a commitment to excellence, PK has become a go-to expert in the world of Excel. Whether you're looking to create stunning visualizations or streamline your workflow with automation, PK has the skills and expertise to help you succeed. Join the many satisfied clients who have benefited from PK's services and see how he can take your Excel skills to the next level!
https://www.pk-anexcelexpert.com
Related Articles
3 Ways to use the Drill Through in Power BI
In this article, you will learn 3 different ways to Drill Through in Power BI. Drill through is used to
Beer Mug Graph in excel
Beer mug chart is a beautiful infographic representation for KPI metrics in percentage like - Target Achieved%, Service Level%, Quality
Hands-On Guide to Automating Your Excel Data Sorting with VBA
Introduction Data sorting in Excel is a common task for many users. However, when you need to sort large sets