Managing logistics operations is a complex process. From inventory management to delivery timelines, businesses must monitor performance constantly to ensure cost efficiency and customer satisfaction. This is where a Logistics KPI Dashboard in Excel becomes a powerful tool.
In this article, we will explore everything about a logistics KPI dashboard in Excel — its structure, importance, advantages, opportunities for improvement, best practices, and step-by-step usage. By the end, you will also find answers to the most frequently asked questions on this topic.
Click to Purchases Logistics KPI Dashboard in Excel
What Is a Logistics KPI Dashboard in Excel?
A Logistics KPI Dashboard in Excel is a structured tool that allows businesses to track, measure, and analyze logistics performance using Key Performance Indicators (KPIs).
Instead of relying on scattered reports, this dashboard provides a single view of all critical metrics such as order accuracy, on-time delivery, transport costs, and warehouse efficiency.
Excel is the preferred choice for many businesses because it is affordable, easy to customize, and widely available. With built-in formulas, pivot tables, slicers, and charts, Excel offers everything needed to build a professional logistics dashboard.
Key Features of the Logistics KPI Dashboard in Excel
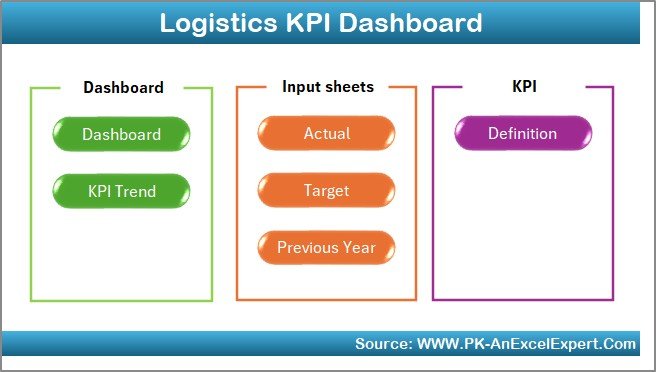
The dashboard structure typically contains seven worksheet tabs. Each tab has a specific function to make data input, tracking, and visualization simple.
Home Sheet
-
Works as an index page.
-
Provides buttons to navigate quickly to other sheets like Dashboard, KPI Trend, Input sheets, and more.
-
Saves time by avoiding manual scrolling.
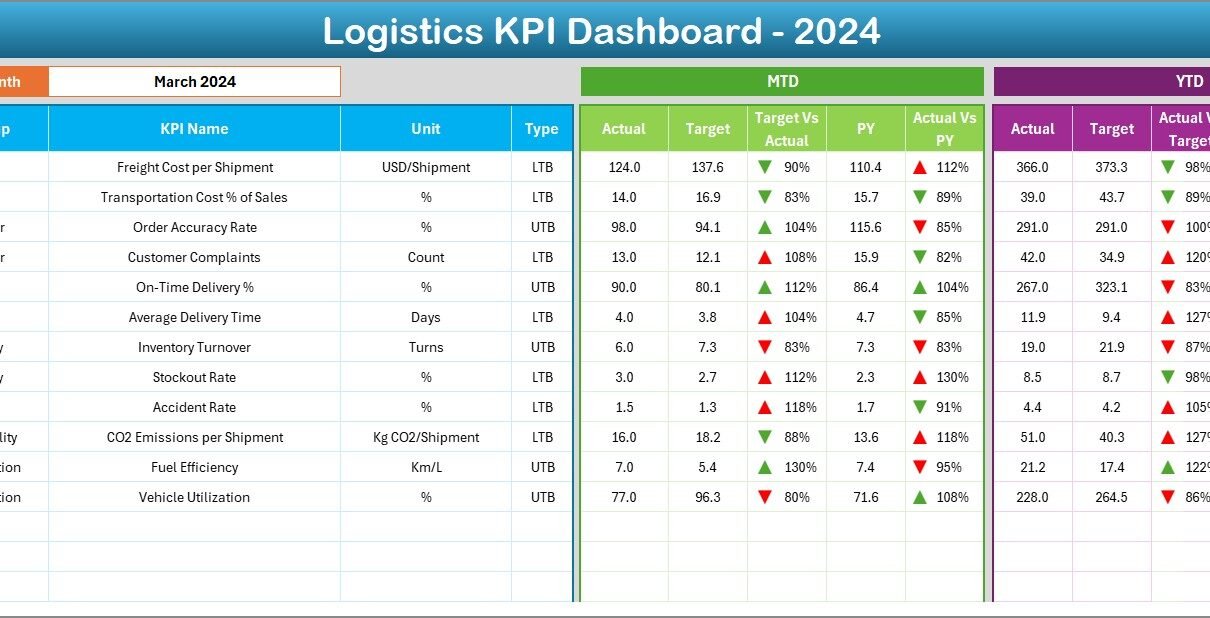
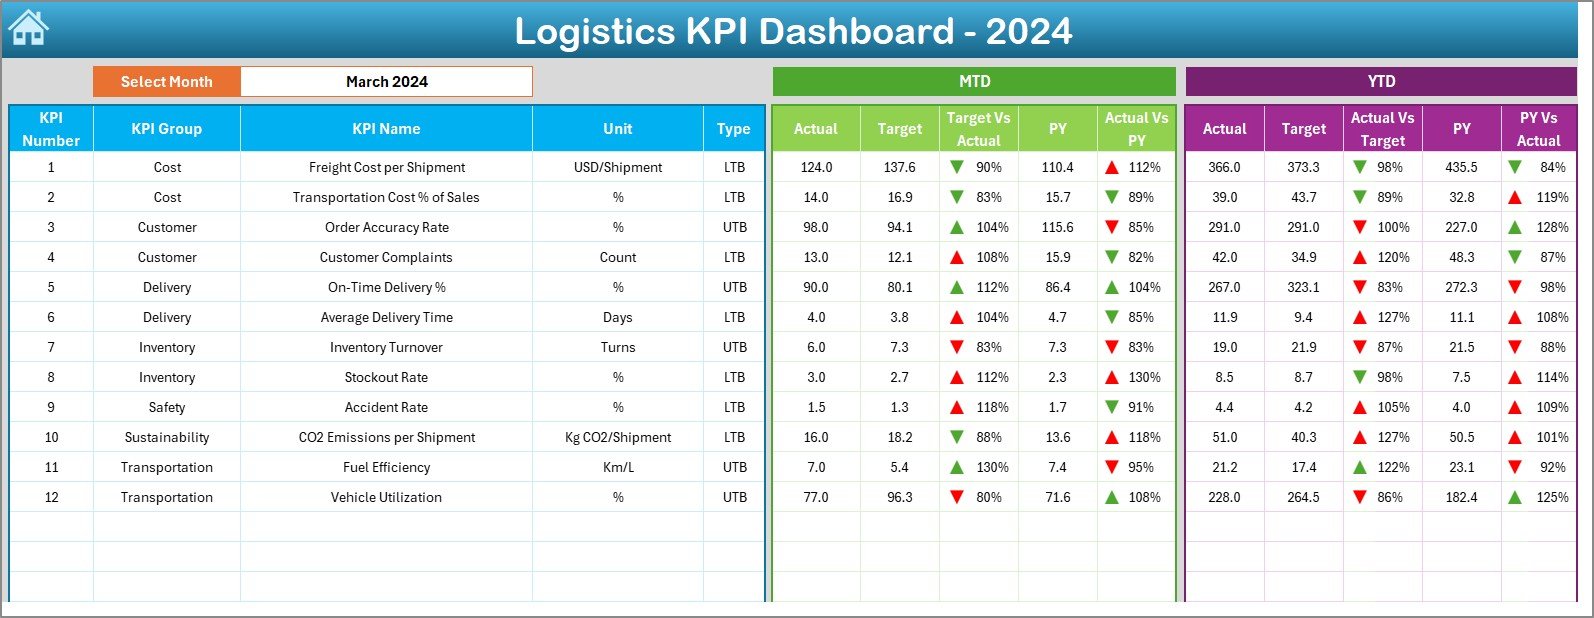
Dashboard Sheet
-
The main visualization page.
-
Displays all KPI values in one place.
-
Features month selector (dropdown on D3). When you change the month, the dashboard automatically updates.
Shows both Month-to-Date (MTD) and Year-to-Date (YTD) numbers for:
- Actual
- Target
- Previous Year (PY)
-
Includes conditional formatting with green ↑ or red ↓ arrows to highlight performance against targets.
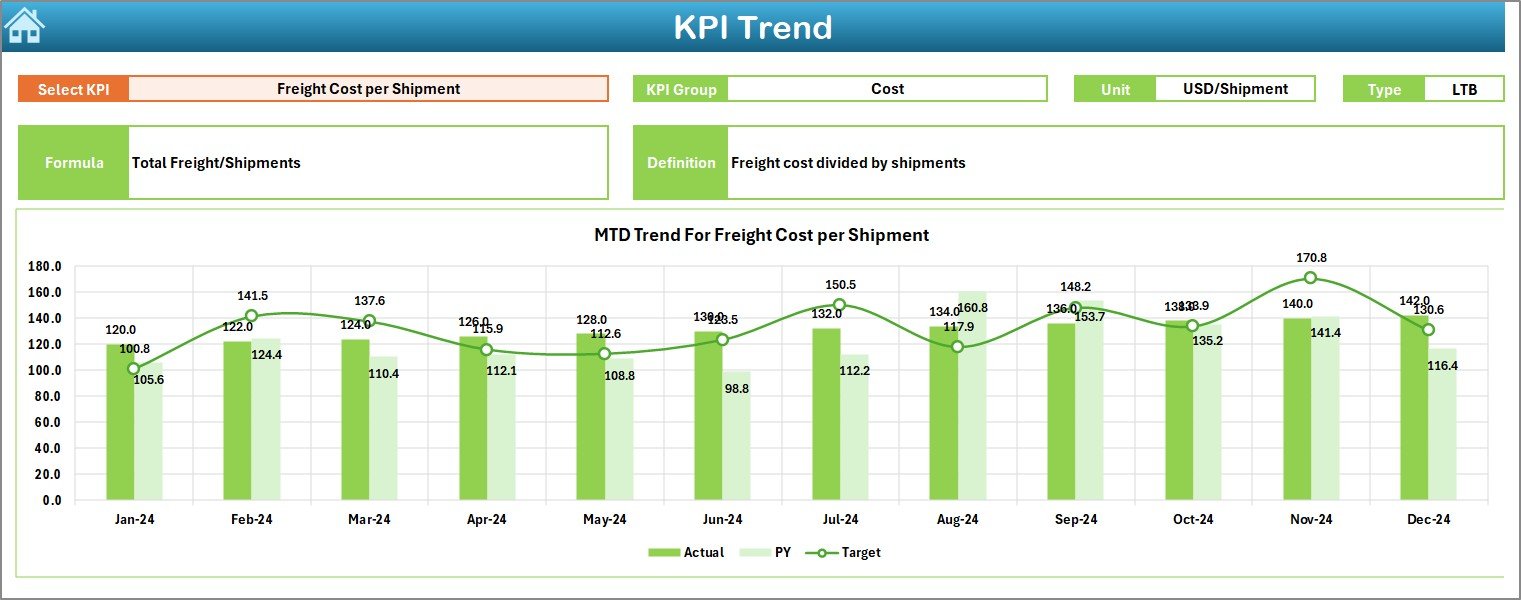
KPI Trend Sheet
-
Allows you to select a specific KPI from a dropdown.
Shows KPI details such as:
- KPI Group
- Unit of Measurement
- Type (LTB = Lower the Better, UTB = Upper the Better)
- Formula
- Definition
-
Displays trend charts for MTD and YTD performance versus target and previous year.
Click to Purchases Logistics KPI Dashboard in Excel
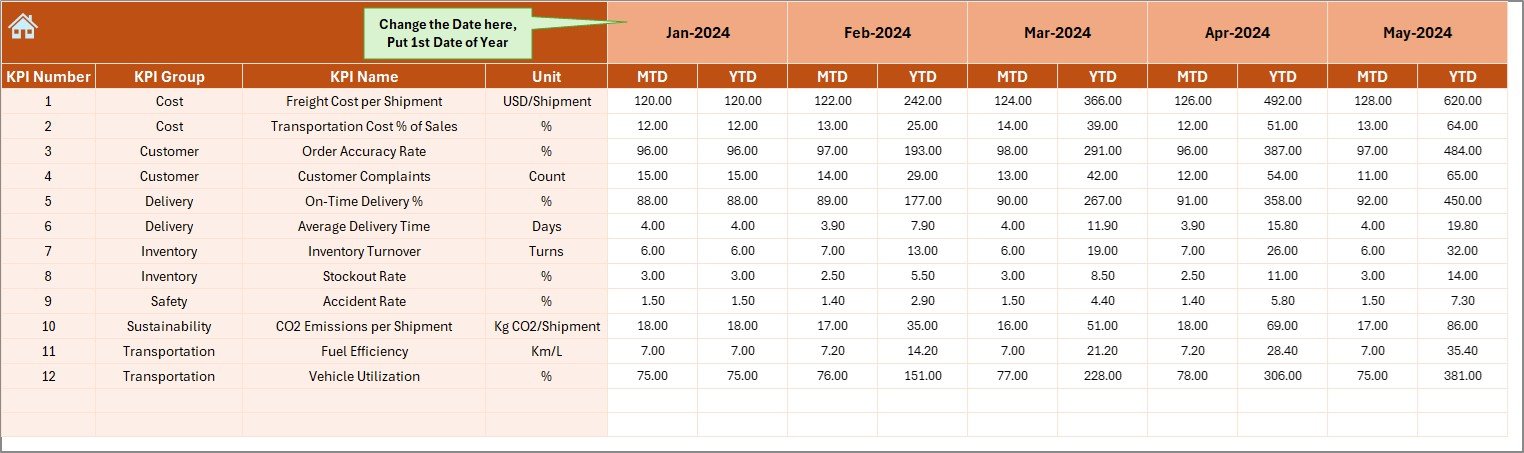
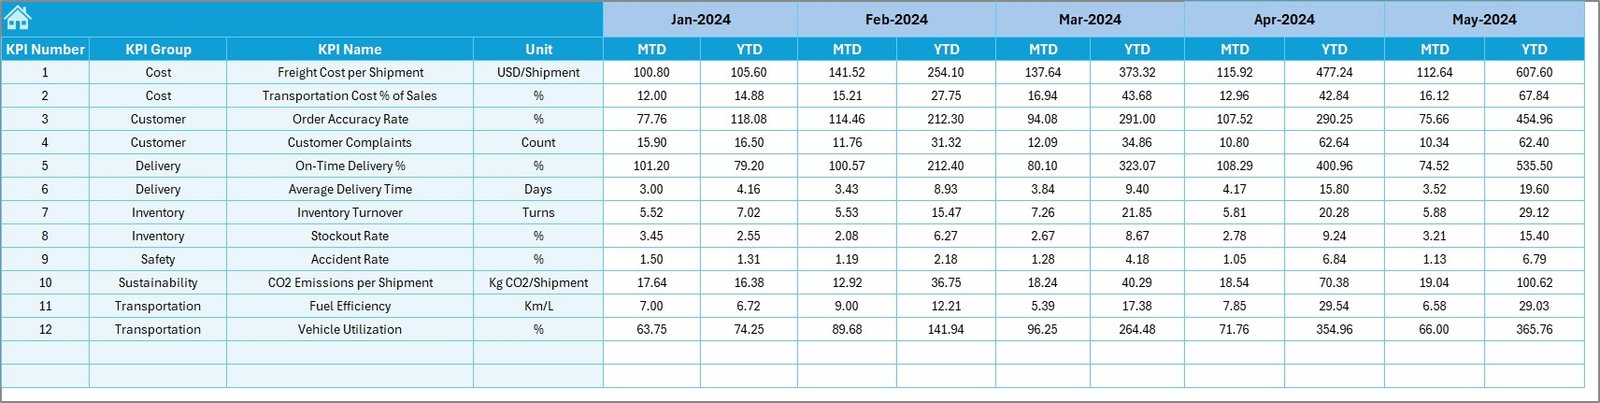
Actual Numbers Input Sheet
-
The place where users enter actual performance values.
-
Designed with an easy month selector (E1) to set the starting month of the year.
-
Supports entry of both MTD and YTD actuals.
Target Sheet
-
Stores monthly targets for each KPI.
-
Tracks both MTD and YTD target values.
-
Serves as the benchmark for performance measurement.
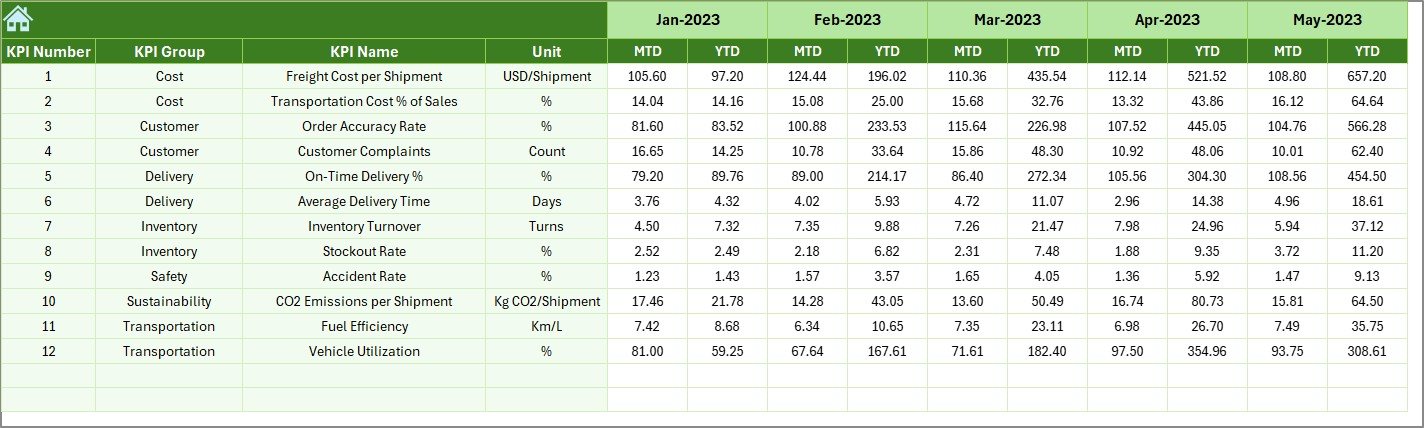
Previous Year Numbers Sheet
-
Stores the previous year’s actual values.
-
Helps in analyzing year-on-year performance.
-
Critical for identifying seasonal patterns in logistics operations.
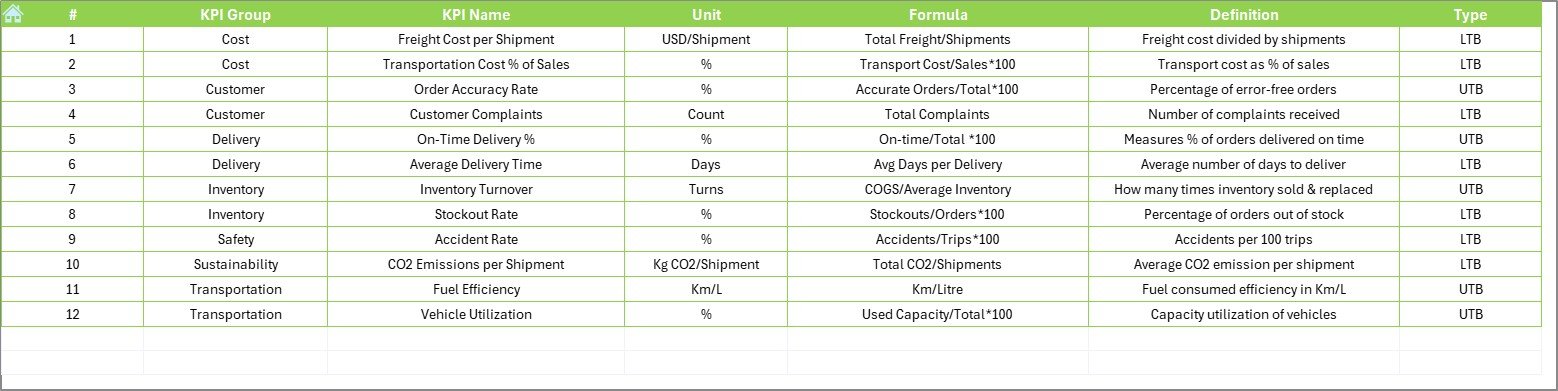
KPI Definition Sheet
-
Provides a reference table for all KPIs.
-
Includes details such as KPI Name, Group, Unit, Formula, and Definition.
-
Ensures clarity and standardization across the organization.
Why Do Businesses Need a Logistics KPI Dashboard?
Logistics is the backbone of supply chain management. Without effective tracking, businesses risk delays, higher costs, and poor customer experiences.
A Logistics KPI Dashboard helps businesses:
-
Monitor performance in real time.
-
Compare actual results with targets and previous year.
-
Identify inefficiencies early.
-
Provide data-driven insights for better decisions.
-
Improve customer satisfaction through timely deliveries and accurate order fulfillment.
Advantages of a Logistics KPI Dashboard in Excel
A well-designed Excel dashboard provides several benefits:
✅ Centralized View – All KPIs in one place for faster analysis.
✅ Cost Effective – Built on Excel, no expensive software required.
✅ Customizable – Businesses can easily modify KPIs, charts, or layout.
✅ Data-Driven Decisions – Managers can identify issues early and take corrective actions.
✅ Historical Comparison – Compare results with previous year to see growth or decline.
✅ Easy to Use – Requires basic Excel skills; no technical training needed.
Opportunities for Improvement
Even though Excel dashboards are powerful, there are always areas for improvement:
📌 Automation – Manual data entry can be reduced with Power Query or VBA macros.
📌 Data Accuracy – Ensure error-free formulas and data validation.
📌 Scalability – Large datasets may slow Excel; consider connecting with Power BI for big data.
📌 Collaboration – Use cloud storage (OneDrive/Google Drive) to allow multiple users access.
📌 Real-Time Data – Integrating with ERP or WMS systems can update dashboards automatically.
Best Practices for a Logistics KPI Dashboard in Excel
To maximize the value of your dashboard, follow these best practices:
✔ Define KPIs clearly – Ensure everyone understands the meaning, formula, and target.
✔ Keep it simple – Avoid overcrowding with too many visuals. Focus on the most important KPIs.
✔ Use conditional formatting – Highlight good and bad performance for quick decisions.
✔ Update regularly – Enter actual numbers every week or month to keep it relevant.
✔ Ensure data consistency – Use drop-downs and lists to standardize data entry.
✔ Add interactivity – Use slicers and filters for dynamic analysis.
✔ Document everything – Maintain a KPI Definition sheet to ensure clarity.
Practical Use Cases of the Logistics KPI Dashboard
Different teams in logistics can use the dashboard in unique ways:
-
Warehouse Managers – Track inventory accuracy, order picking efficiency, and storage utilization.
-
Transport Managers – Monitor fleet costs, fuel consumption, and delivery times.
-
Customer Service Teams – Measure on-time delivery and order accuracy for better customer satisfaction.
-
Finance Teams – Review cost per shipment and compare with revenue impact.
-
Operations Managers – Identify bottlenecks in supply chain processes.
Step-by-Step Guide to Using the Dashboard
-
Start at the Home Sheet
-
Use navigation buttons to reach the desired section quickly.
-
-
Enter Targets
-
Open the Target Sheet and update monthly targets for each KPI.
-
-
Enter Previous Year Data
-
Populate the Previous Year Numbers Sheet with last year’s values.
-
-
Input Actuals
-
Enter current year’s performance data in the Actual Numbers Input Sheet.
-
-
View the Dashboard
-
Go to the Dashboard sheet and select the desired month from D3.
-
Analyze KPI performance with charts, arrows, and comparison tables.
-
-
Check KPI Trends
-
Use the KPI Trend sheet to analyze performance patterns over time.
-
Conclusion
A Logistics KPI Dashboard in Excel is an essential tool for businesses that want to optimize supply chain operations, reduce costs, and enhance customer satisfaction. It provides a structured, affordable, and user-friendly way to track performance metrics.
When used effectively with best practices, this dashboard not only highlights performance gaps but also guides managers toward smarter, data-driven decisions.
Frequently Asked Questions (FAQs)
1. What are the most important KPIs for logistics?
Some common logistics KPIs include on-time delivery %, order accuracy %, transportation cost per unit, warehouse utilization rate, and return rate.
2. Why use Excel for a logistics KPI dashboard?
Excel is cost-effective, flexible, and widely used. It offers formulas, pivot tables, and charts that make dashboard creation simple and powerful.
3. How often should the dashboard be updated?
Ideally, update it monthly for strategic review. Some businesses also update weekly for operational control.
4. Can Excel dashboards handle large logistics data?
Yes, but performance may slow with very large datasets. For bigger operations, you can integrate Excel with Power BI or SQL databases.
5. How do I ensure data accuracy in the dashboard?
Use data validation, drop-down lists, and standardized formats. Also, cross-check actual numbers before finalizing.
6. Is it possible to automate data entry in Excel dashboards?
Yes. You can use Power Query, VBA macros, or connect Excel directly to ERP/WMS systems for automation.
7. Who can benefit from a logistics KPI dashboard?
Operations managers, warehouse supervisors, transport teams, finance departments, and customer service teams all benefit from using the dashboard.
Visit our YouTube channel to learn step-by-step video tutorials
Click to Purchases Logistics KPI Dashboard in Excel