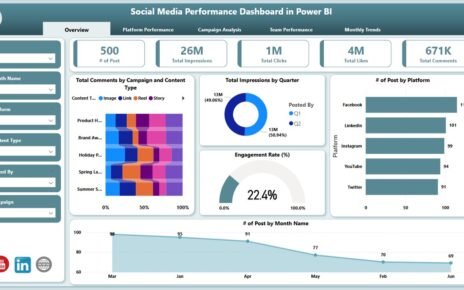
In today’s fast-paced digital world, brands must track social media metrics to stay ahead of competitors. A Social Media Performance
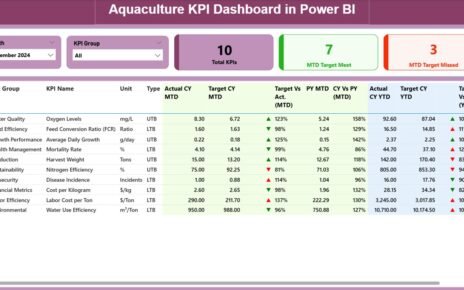
The aquaculture industry is one of the fastest-growing food production sectors in the world. With increasing demand for seafood and
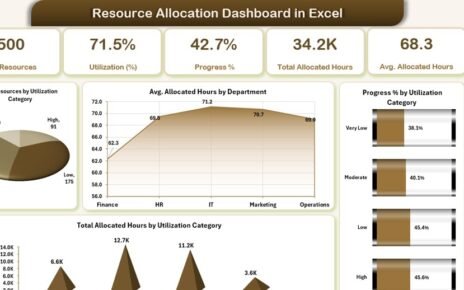
In any organization, managing resources effectively can be the difference between a successful project and a missed deadline. Whether you're