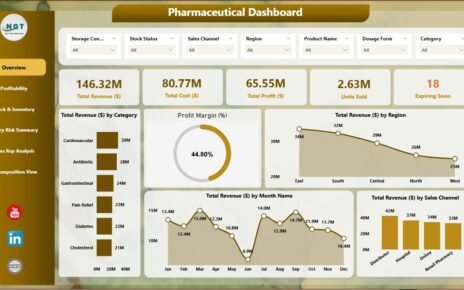
Home>Blogs>Power Point Visualization>Animated Target Vs Actual Sales Chart in Power Point>Target Vs Actual Sales Chart
Target Vs Actual Sales Chart
12
Sep 2019
551Comments Off on Target Vs Actual Sales Chart
PK
Meet PK, the founder of PK-AnExcelExpert.com! With over 15 years of experience in Data Visualization, Excel Automation, and dashboard creation. PK is a Microsoft Certified Professional who has a passion for all things in Excel. PK loves to explore new and innovative ways to use Excel and is always eager to share his knowledge with others. With an eye for detail and a commitment to excellence, PK has become a go-to expert in the world of Excel. Whether you're looking to create stunning visualizations or streamline your workflow with automation, PK has the skills and expertise to help you succeed. Join the many satisfied clients who have benefited from PK's services and see how he can take your Excel skills to the next level!
https://www.pk-anexcelexpert.com
Related Articles
Event Production KPI Dashboard in Power BI
Event production requires speed, planning, and real-time performance tracking. Every event brings many moving parts—venue operations, logistics, staffing, budgeting, timelines,
Ports and Harbors KPI Dashboard in Excel
Ports and harbors operate in a highly demanding environment where efficiency, safety, compliance, and operational excellence matter every single day.
Derivatives Trading KPI Dashboard in Excel
Derivatives trading involves high risk, fast decisions, and constant performance pressure. Traders, portfolio managers, and risk teams must track results


