Managing a car rental business involves more than just renting vehicles. Every day, teams must track rentals, revenue, maintenance costs, customer behavior, and city-wise demand. However, when data remains scattered across spreadsheets or systems, decisions become slow and reactive.
That is exactly where a Car Rental Services Dashboard in Power BI becomes a powerful solution.
This in-depth article explains what a Car Rental Services Dashboard in Power BI is, how it works, its key features, advantages, best practices, and real-world use cases. Additionally, you will learn how each dashboard page supports faster, smarter, and data-driven decisions for car rental businesses.
Click to Purchases Car Rental Services Dashboard in Power BI
What Is a Car Rental Services Dashboard in Power BI?
A Car Rental Services Dashboard in Power BI is an interactive reporting solution designed to analyze car rental operations using real-time visuals and KPIs.
Instead of reviewing multiple Excel files, managers can instantly monitor:
-
Total rentals
-
Net revenue
-
Maintenance costs
-
Customer behavior
-
City and branch performance
-
Monthly rental trends
Because Power BI supports slicers, filters, and drill-downs, users can explore insights dynamically. As a result, decision-makers gain complete control over rental operations.
Why Do Car Rental Businesses Need a Dashboard in Power BI?
Car rental companies operate in a fast-moving environment. Therefore, delays in insights often lead to lost revenue, higher costs, and poor customer experience.
Without a dashboard:
-
Reports remain static
-
Trends remain hidden
-
Cost overruns go unnoticed
-
Decisions rely on guesswork
However, with a Power BI dashboard:
-
Data becomes visual and actionable
-
Performance gaps become visible instantly
-
Teams respond faster and smarter
Thus, a dashboard is not optional anymore—it is essential.
How Does a Car Rental Services Dashboard in Power BI Work?
The dashboard works by connecting rental data from Excel, databases, or booking systems into Power BI.
The Process Flow
-
Import rental, revenue, and maintenance data
-
Clean and model data using Power Query
-
Create KPIs and calculated measures
-
Design interactive visuals and slicers
-
Publish insights through dashboard pages
Because everything updates dynamically, users always see the latest performance.
What Are the Key Features of a Car Rental Services Dashboard in Power BI?
This dashboard includes five structured analytical pages, each designed for a specific business question.
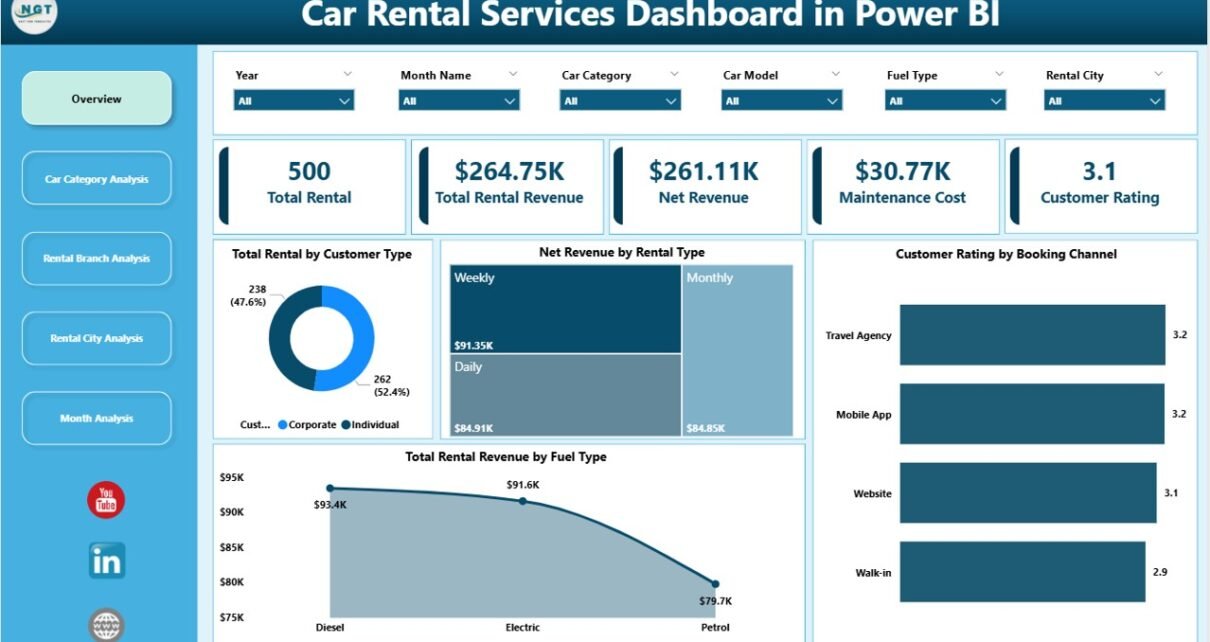
1. Overview Page: How Can You Monitor Overall Rental Performance?
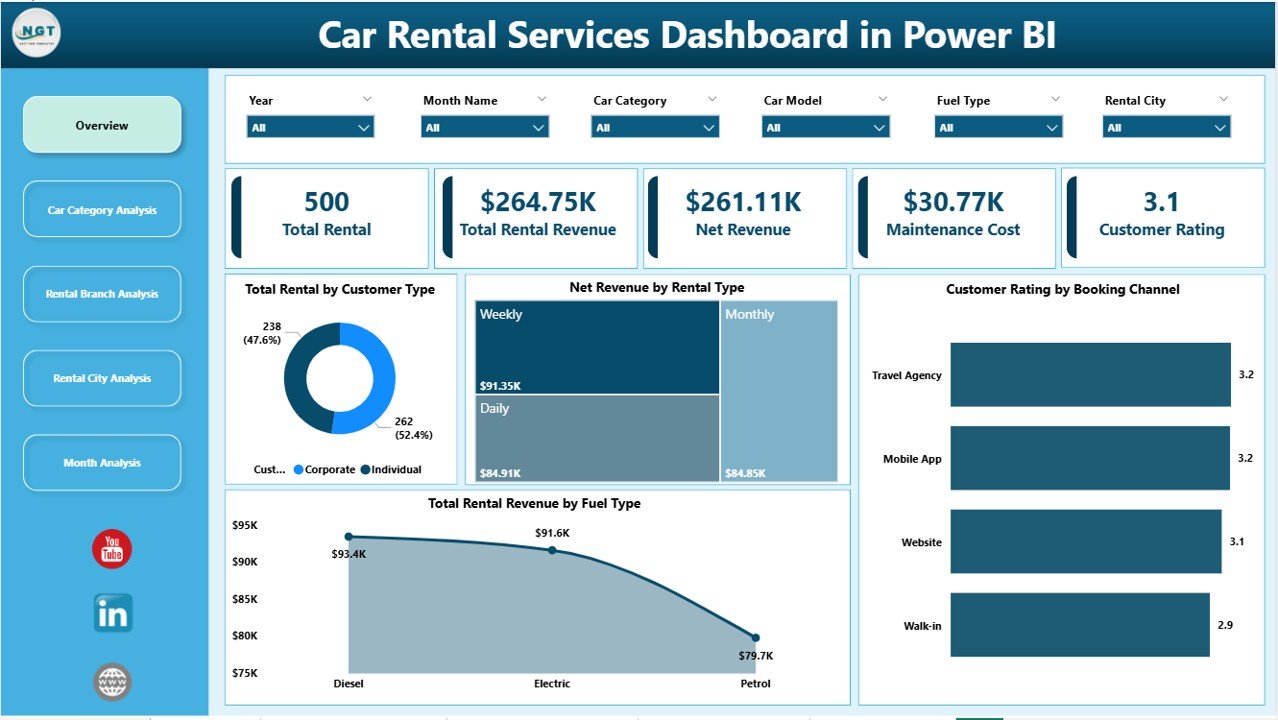
The Overview Page acts as the control center of the dashboard.
Key Highlights
-
Interactive slicers for quick filtering
-
High-level KPIs for instant insights
KPI Cards on the Overview Page
-
Total Rental by Customer Type
-
Net Revenue by Rental Type
-
Customer Rating by Booking Channel
-
Total Rental Revenue by Fuel Type
Why This Page Matters
Because all critical KPIs appear in one place, managers can quickly assess overall health. As a result, leadership teams save time and act faster.
2. Car Category Analysis: Which Car Types Drive Maximum Revenue?
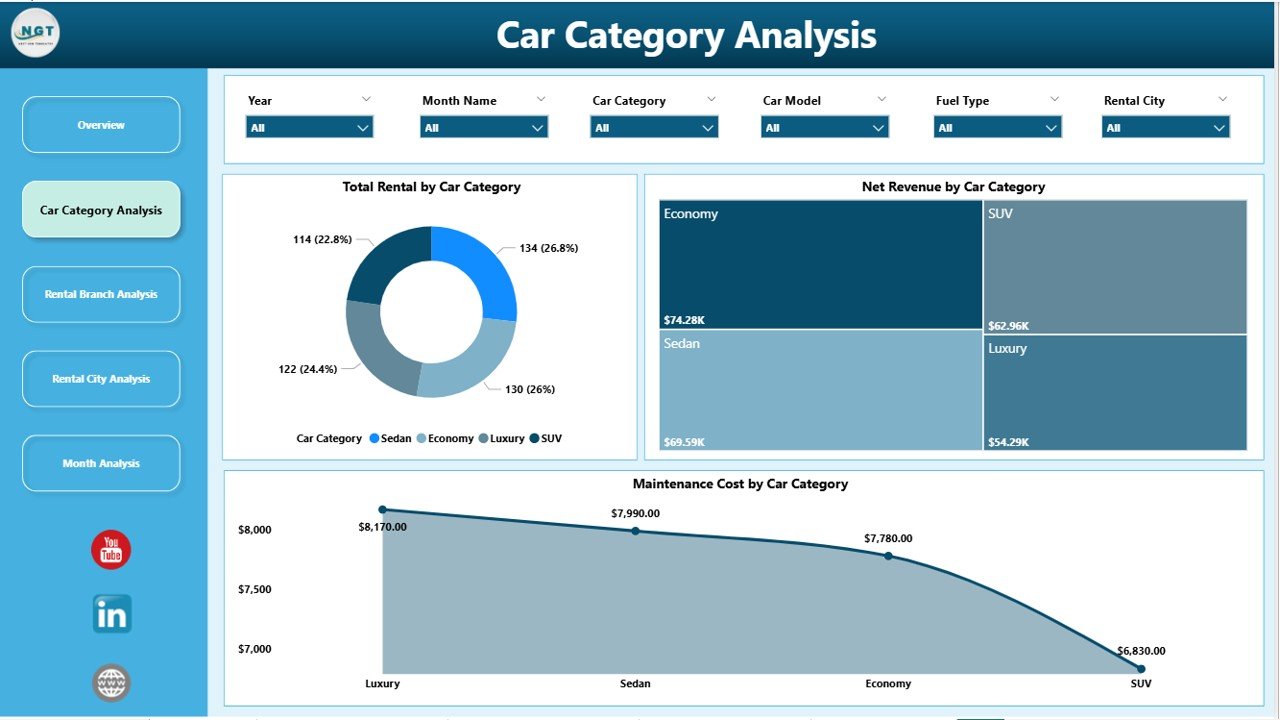
Different car categories generate different rental patterns and costs. Therefore, analyzing performance by category becomes crucial.
Charts Included
-
Total Rental by Car Category
-
Net Revenue by Car Category
-
Maintenance Cost by Car Category
Business Value
-
Identify high-performing car categories
-
Detect costly vehicle segments
-
Optimize fleet composition
Consequently, businesses invest more in profitable categories and reduce losses.
Click to Purchases Car Rental Services Dashboard in Power BI
3. Rental Branch Analysis: Which Branches Perform Best?
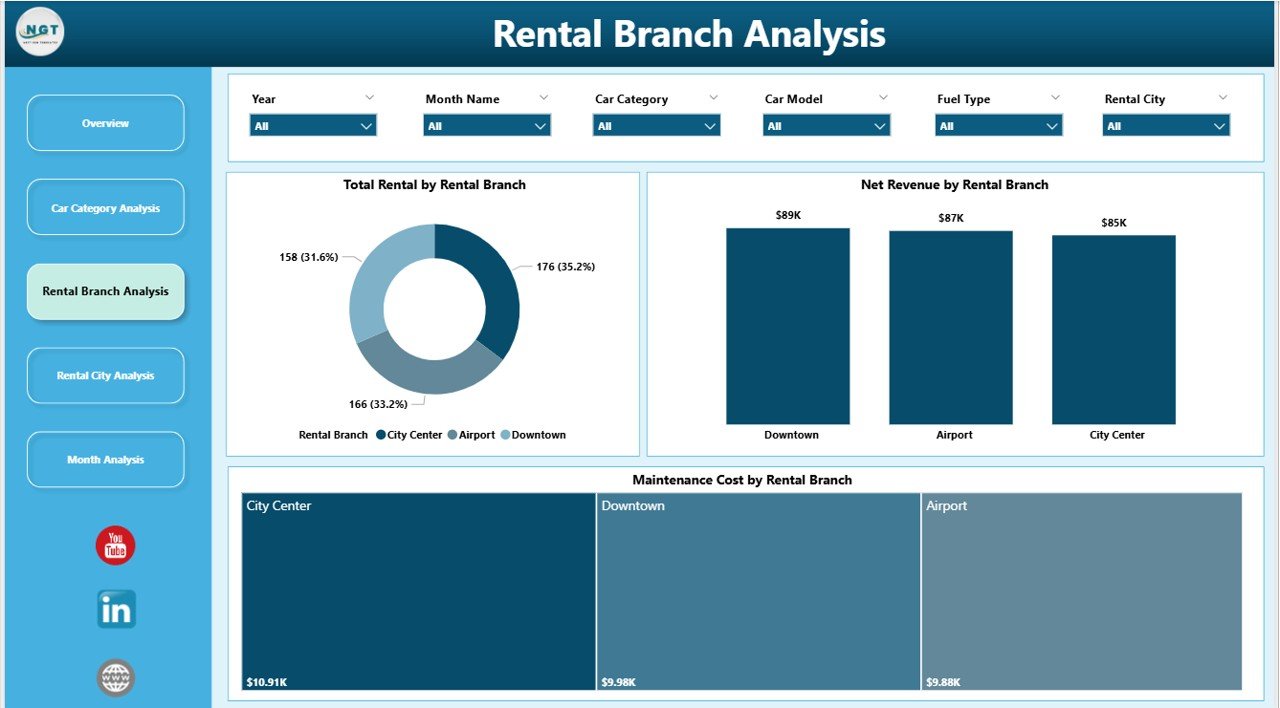
Branch-level visibility plays a critical role in operational efficiency.
Charts Included
-
Total Rental by Rental Branch
-
Net Revenue by Rental Branch
-
Maintenance Cost by Rental Branch
Why This Analysis Helps
-
Compare branch productivity
-
Identify underperforming locations
-
Improve branch-level accountability
As a result, management can allocate resources more effectively.
4. Rental City Analysis: How Does Demand Vary Across Cities?
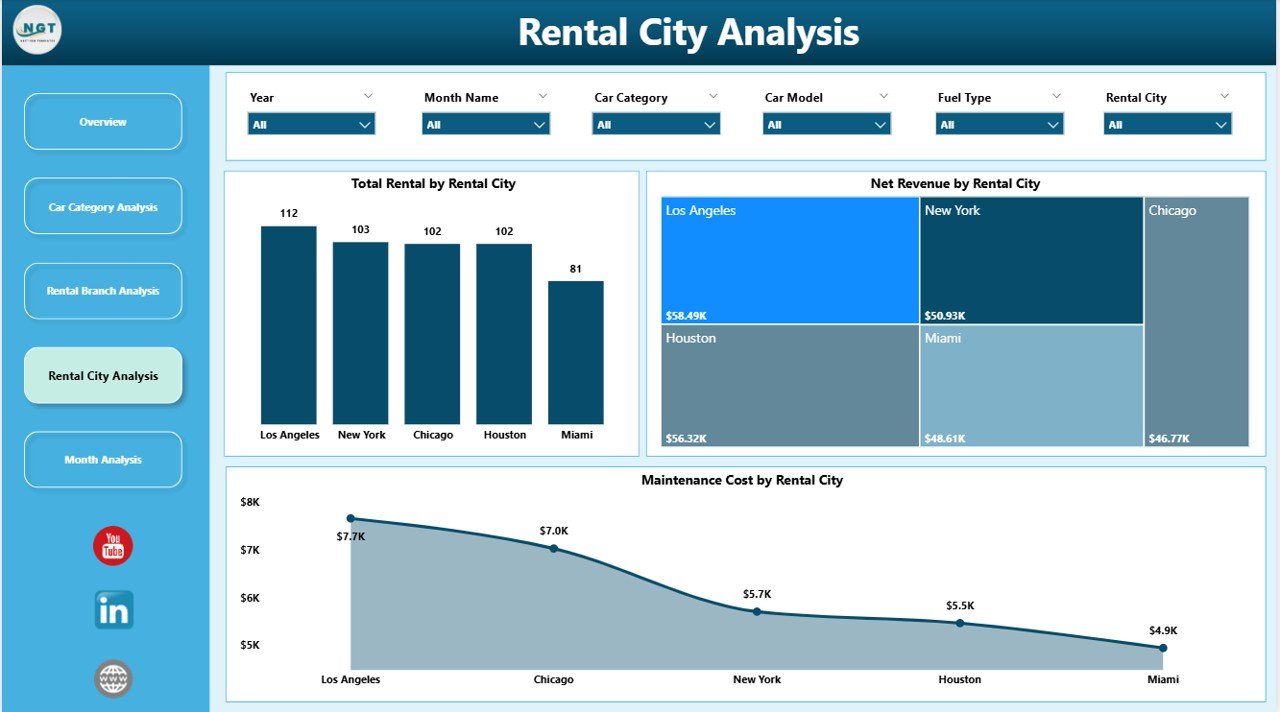
City-wise demand often fluctuates due to tourism, business travel, and seasonality. Therefore, analyzing performance by city becomes essential.
Charts Included
-
Total Rental by Rental City
-
Net Revenue by Rental City
-
Maintenance Cost by Rental City
-
Click to Purchases Car Rental Services Dashboard in Power BI
Key Insights Gained
-
Identify high-demand cities
-
Plan fleet distribution strategically
-
Control city-wise maintenance expenses
Thus, businesses improve regional planning and profitability.
5. Month Analysis: How Do Rentals and Revenue Change Over Time?
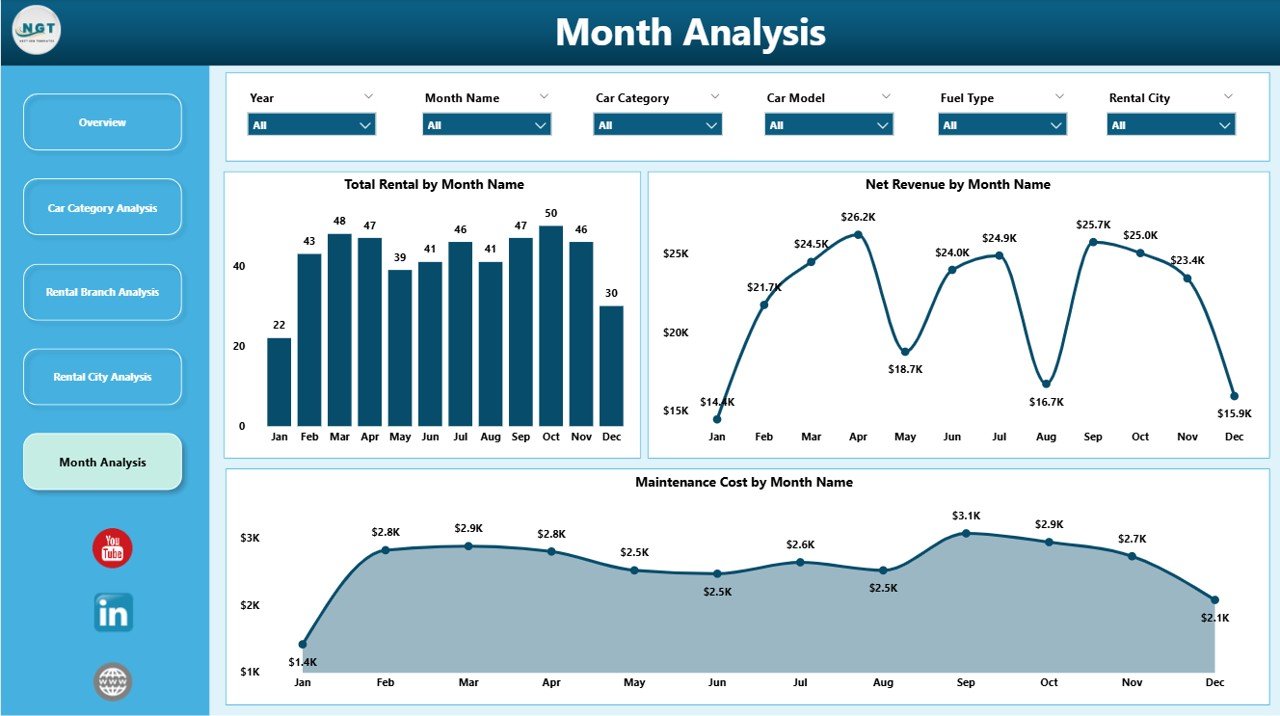
Understanding monthly trends helps in forecasting and budgeting.
Charts Included
-
Total Rental by Month
-
Net Revenue by Month
-
Maintenance Cost by Month
Why Monthly Analysis Is Important
-
Identify seasonal peaks and dips
-
Forecast demand accurately
-
Plan promotions and pricing strategies
As a result, businesses stay prepared throughout the year.
Advantages of Car Rental Services Dashboard in Power BI
A Power BI dashboard delivers measurable value across the organization.
1. Real-Time Decision Making
Because data refreshes dynamically, managers always work with updated numbers.
2. Improved Revenue Visibility
Revenue trends become clear across customer types, cities, and months.
3. Better Cost Control
Maintenance costs remain visible and traceable, preventing overspending.
4. Enhanced Fleet Optimization
Car category insights help maintain the right fleet mix.
5. Time-Saving Reporting
Automated dashboards eliminate manual reporting efforts.
6. Scalable and Flexible Design
The dashboard adapts easily as the business grows.
Who Can Use a Car Rental Services Dashboard?
This dashboard supports multiple roles within an organization.
-
Business owners
-
Operations managers
-
Fleet managers
-
Finance teams
-
Regional managers
-
Strategy and planning teams
Because Power BI requires minimal training, even non-technical users benefit.
How Does This Dashboard Improve Customer Experience?
Click to Purchases Car Rental Services Dashboard in Power BI
Customer satisfaction depends on availability, pricing, and service quality.
With this dashboard:
-
High-demand cities receive sufficient vehicles
-
Maintenance issues reduce downtime
-
Customer ratings highlight service gaps
As a result, businesses deliver better service consistently.
Best Practices for the Car Rental Services Dashboard in Power BI
To get maximum value, follow these proven best practices.
1. Keep Data Clean and Consistent
Ensure rental dates, categories, and revenue fields remain standardized.
2. Use Clear KPI Definitions
Define metrics like net revenue and maintenance cost clearly.
3. Design with Simplicity
Avoid clutter and focus on decision-ready visuals.
4. Leverage Slicers Effectively
Enable filters for city, branch, category, and month.
5. Review Dashboard Regularly
Update visuals as business priorities evolve.
6. Train Users Briefly
Short training ensures teams use insights correctly.
How Can This Dashboard Support Strategic Planning?
Strategic planning requires historical data and trend analysis.
This dashboard helps by:
-
Identifying growth opportunities
-
Highlighting loss-making segments
-
Supporting data-driven expansion decisions
Therefore, long-term planning becomes accurate and confident.
Common Use Cases of Car Rental Services Dashboard
-
Monthly performance reviews
-
Branch comparison meetings
-
Fleet optimization planning
-
Revenue forecasting
-
Maintenance cost control
Because insights remain visual, discussions become focused and productive.
Conclusion: Why Is a Car Rental Services Dashboard in Power BI a Must-Have?
A Car Rental Services Dashboard in Power BI transforms raw rental data into clear, actionable intelligence.
Instead of reacting late, businesses respond early.
Instead of guessing, teams decide with confidence.
Instead of manual work, reporting becomes automated.
Ultimately, this dashboard empowers car rental companies to grow revenue, control costs, and deliver exceptional customer experiences.
Frequently Asked Questions (FAQs)
1. What data is required for a Car Rental Services Dashboard in Power BI?
You need rental transactions, revenue details, maintenance costs, car categories, branch data, and dates.
2. Can this dashboard work with Excel data?
Yes, Power BI connects seamlessly with Excel files.
3. Is technical expertise required to use the dashboard?
No. Users only need basic Power BI navigation skills.
4. Can the dashboard be customized?
Yes, charts, KPIs, and filters can be customized easily.
5. How often does the dashboard update?
The dashboard updates based on the data refresh schedule.
6. Is this dashboard suitable for small rental businesses?
Yes. It scales well for both small and large businesses.
Visit our YouTube channel to learn step-by-step video tutorials