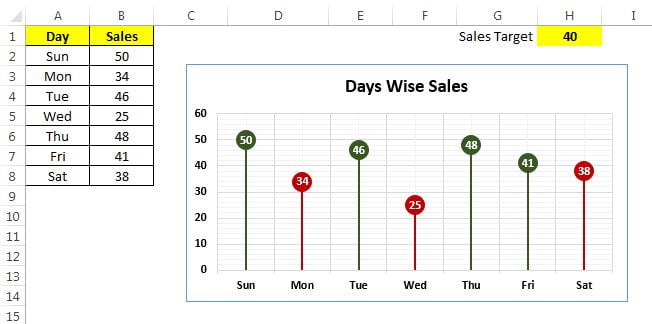
Introduction Small Business Cash Flow Calendar in Excel is a powerful tool designed to help business owners manage their cash
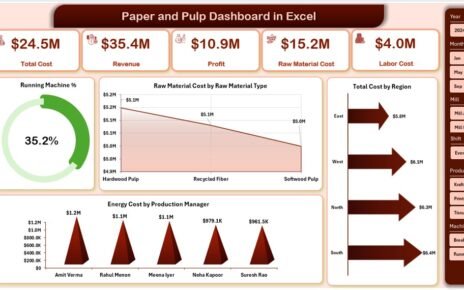
he paper and pulp industry runs on efficiency, cost control, and production accuracy. However, many mills still depend on scattered
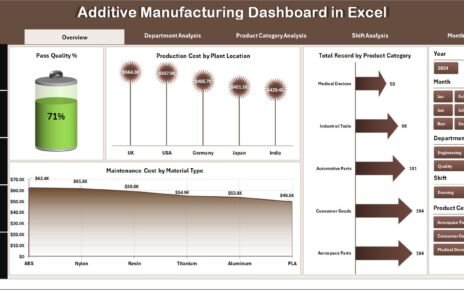
Manufacturing industries continue to evolve rapidly. Among all modern manufacturing technologies, Additive Manufacturing, also known as 3D Printing, stands out