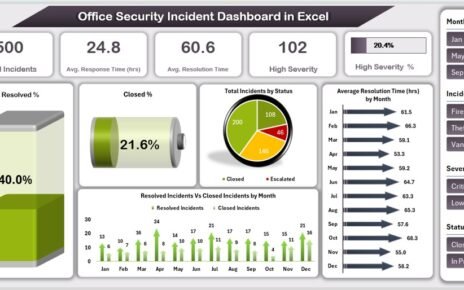
Home>Blogs>Charts and Visualization>Cross Filter Functionality in Excel Chart>Cross Filter in Excel Chart
Cross Filter in Excel Chart
05
Jul 2021
66Comments Off on Cross Filter in Excel Chart
PK
Meet PK, the founder of PK-AnExcelExpert.com! With over 15 years of experience in Data Visualization, Excel Automation, and dashboard creation. PK is a Microsoft Certified Professional who has a passion for all things in Excel. PK loves to explore new and innovative ways to use Excel and is always eager to share his knowledge with others. With an eye for detail and a commitment to excellence, PK has become a go-to expert in the world of Excel. Whether you're looking to create stunning visualizations or streamline your workflow with automation, PK has the skills and expertise to help you succeed. Join the many satisfied clients who have benefited from PK's services and see how he can take your Excel skills to the next level!
https://www.pk-anexcelexpert.com
Related Articles
Home Health Care KPI Dashboard in Excel
In the rapidly evolving home health care industry, it’s essential to have effective tools for monitoring key performance indicators (KPIs).
News and Journalism KPI Dashboard in Power BI
The news and journalism industry moves fast. Every hour, new stories break, audience behavior changes, and digital platforms evolve. Because
Revenue Analysis Dashboard in Power BI
In today’s fast-moving business environment, organizations cannot afford to make decisions based on guesswork. Data-driven insights are the foundation of


