Home>Blogs>Charts and Visualization>Cross Filter Functionality in Excel Chart>Cross Filter in Excel Chart -2
Cross Filter in Excel Chart -2
05
Jul 2021
113Comments Off on Cross Filter in Excel Chart -2
PK
Meet PK, the founder of PK-AnExcelExpert.com! With over 15 years of experience in Data Visualization, Excel Automation, and dashboard creation. PK is a Microsoft Certified Professional who has a passion for all things in Excel. PK loves to explore new and innovative ways to use Excel and is always eager to share his knowledge with others. With an eye for detail and a commitment to excellence, PK has become a go-to expert in the world of Excel. Whether you're looking to create stunning visualizations or streamline your workflow with automation, PK has the skills and expertise to help you succeed. Join the many satisfied clients who have benefited from PK's services and see how he can take your Excel skills to the next level!
https://www.pk-anexcelexpert.com
Related Articles
Health Purchasing KPI Dashboard in Power BI
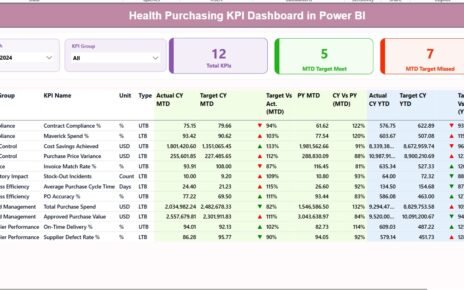
Healthcare organizations handle thousands of purchasing transactions every month. Therefore, without a structured monitoring system, purchasing teams often struggle with
Engineering KPI Dashboard in Power BI
In today’s fast-moving industrial world, engineering teams must maintain precision, productivity, and innovation — all while meeting tight deadlines and
Waste Reduction KPI Dashboard Power BI
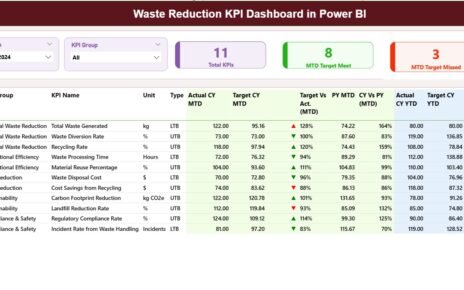
Waste reduction has become a critical priority for organizations across industries. As regulations tighten and sustainability expectations rise, leaders must


