Crypto Portfolio Dashboard in Power BI is a feature-rich cryptocurrency analytics template designed for crypto investors, traders, portfolio managers, and finance professionals who need to monitor and analyze their digital asset portfolios from a single, interactive Power BI report. With 5 dedicated dashboard pages — Overview, Portfolio Analysis, Performance, Exchange Analysis, and Risk Overview — this template transforms raw crypto transaction data into powerful visual insights that help you make smarter investment decisions.
Whether you are tracking Bitcoin, Ethereum, Solana, or dozens of altcoins across multiple exchanges, this dashboard gives you a complete picture of your portfolio health, risk exposure, exchange-level metrics, and monthly performance trends. In this blog post, we will walk you through every page, chart, and KPI included in the Crypto Portfolio Dashboard in Power BI so you can see exactly how it helps you stay on top of your cryptocurrency investments.
Key Features of Crypto Portfolio Dashboard in Power BI
The Crypto Portfolio Dashboard in Power BI includes 5 interactive dashboard pages, each built to deliver specific analytical perspectives on your cryptocurrency portfolio. Here are the standout features that make this template one of the most comprehensive Power BI Dashboard Templates for crypto analytics:
- 5 Interactive Pages — Overview, Portfolio Analysis, Performance, Exchange Analysis, and Risk Overview provide 360-degree portfolio visibility.
- KPI Cards — Total Transactions, Total Investment, Total Current Value, Total Fees, and ROI displayed prominently on the Overview page.
- Win Rate Tracking — Visual indicator showing the percentage of profitable trades in your portfolio.
- Multi-Slicer Filtering — Filter by cryptocurrency, exchange, wallet type, risk level, transaction status, and date range across all pages.
- Exchange Comparison — Avg Trade Size, Total Current Value, and Total Investment broken down by exchange.
- Risk Profiling — ROI by Risk Level, Gain/Loss by Transaction Type, and Current Value by Risk Level.
- Monthly Trends — Total Fees and Gain/Loss by Month Name for seasonal pattern identification.
- Professional Design — Clean, modern Power BI visuals suitable for personal use and executive presentations.
Dashboard Pages Explanation
1. Overview Page
The Overview page is the command center of your Crypto Portfolio Dashboard in Power BI. At the top, high-level KPI cards display the most important metrics at a glance: Total Transactions shows the complete count of all buy, sell, and swap activities in your portfolio. Total Investment displays the cumulative amount you have invested across all cryptocurrencies. Total Current Value shows what your entire portfolio is worth right now. Total Fees tracks the cumulative fees paid across all exchanges and transactions. ROI (Return on Investment) gives you an instant snapshot of your overall portfolio profitability.
Below the KPI cards, interactive charts provide deeper insights. Total Investment and Total Current Value by Wallet Type helps you compare performance across different wallet categories such as hot wallets, cold wallets, and exchange wallets. The Win Rate visualization instantly tells you the percentage of trades that ended profitably. Total Transactions by Risk Level shows how your trading activity is distributed across low, medium, and high risk categories. Total Current Value by Category breaks down your holdings by cryptocurrency category. Total Fees by Month Name reveals fee trends over time so you can identify expensive trading periods. Multiple slicers at the top let you filter the entire page by any dimension.
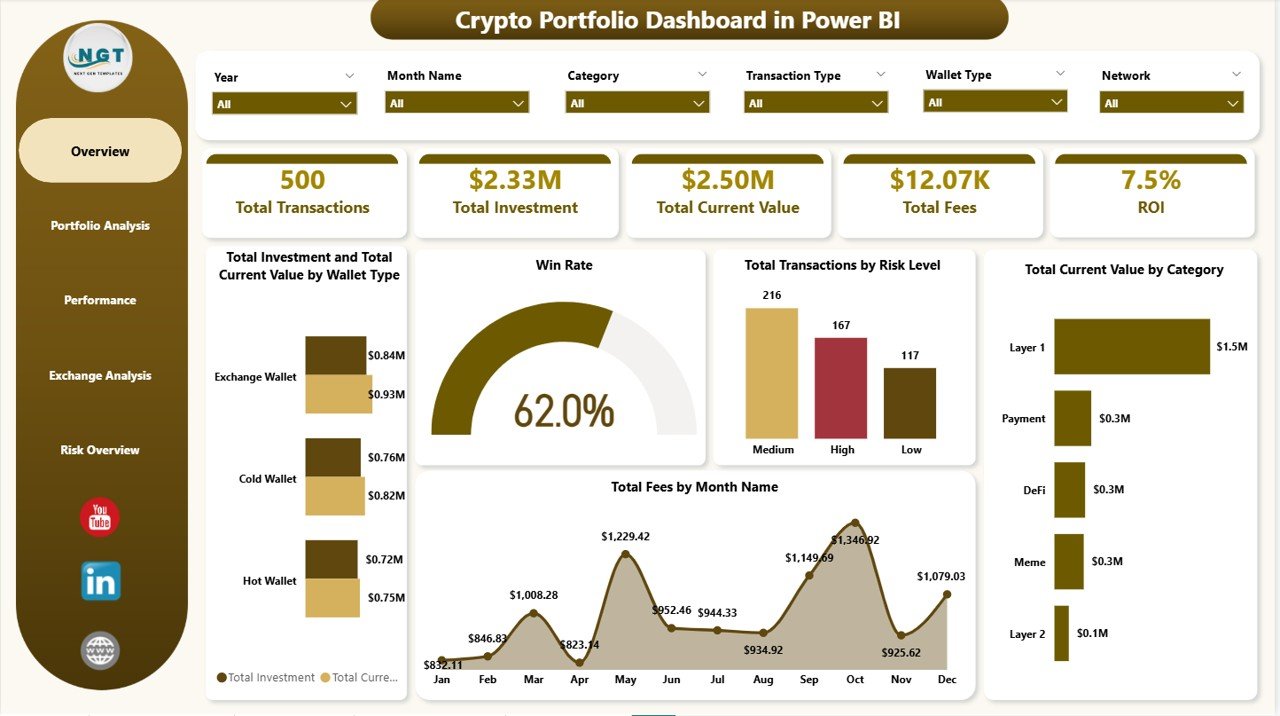
Crypto Portfolio Dashboard in Power BI
2. Portfolio Analysis Page
The Portfolio Analysis page in the Crypto Portfolio Dashboard in Power BI lets you drill deeper into your cryptocurrency holdings and exchange-level returns. Total Current Value by Cryptocurrency shows a detailed breakdown of how much each coin or token in your portfolio is worth right now, making it easy to identify your top-performing assets. ROI by Exchange compares the return on investment across every exchange you trade on — whether that is Binance, Coinbase, Kraken, or others — so you can see which platform delivers the best returns. Total Investment by Risk Level shows how your capital is allocated across low, medium, and high risk investments, helping you rebalance if you are overexposed to any risk category. If you are looking for additional blockchain analytics, check out the Blockchain & Cryptocurrency Dashboard in Power BI blog post.
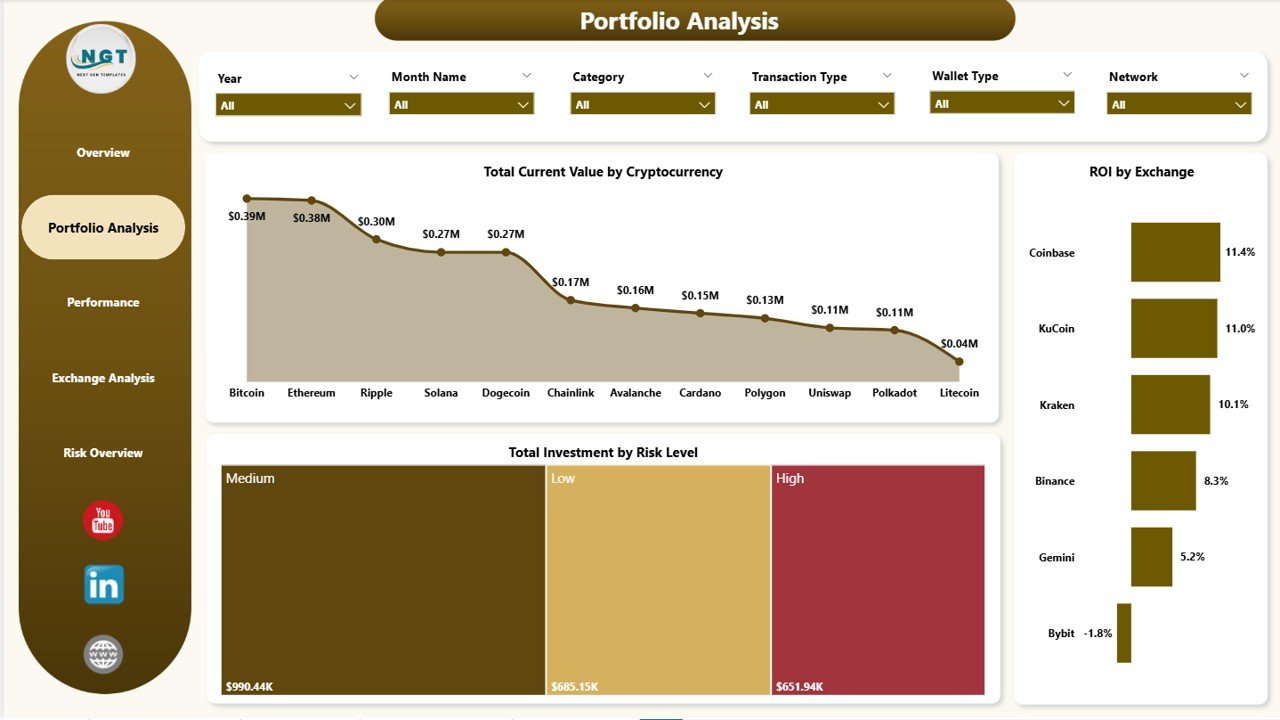
Portfolio Analysis
3. Performance Page
The Performance page focuses on cost efficiency and profitability trends in your crypto portfolio. Total Fees by Wallet Type reveals which wallet categories are costing you the most in transaction fees, helping you optimize where you store and trade your assets. Total Investment by Transaction Status shows the distribution of your capital across completed, pending, and failed transactions so you can identify stuck or delayed trades. Total Gain Loss by Month Name is one of the most important charts on this page — it tracks your monthly profit and loss trends, making it easy to spot which months were the most profitable and which saw the biggest drawdowns. This monthly view is invaluable for adjusting your trading strategy seasonally.
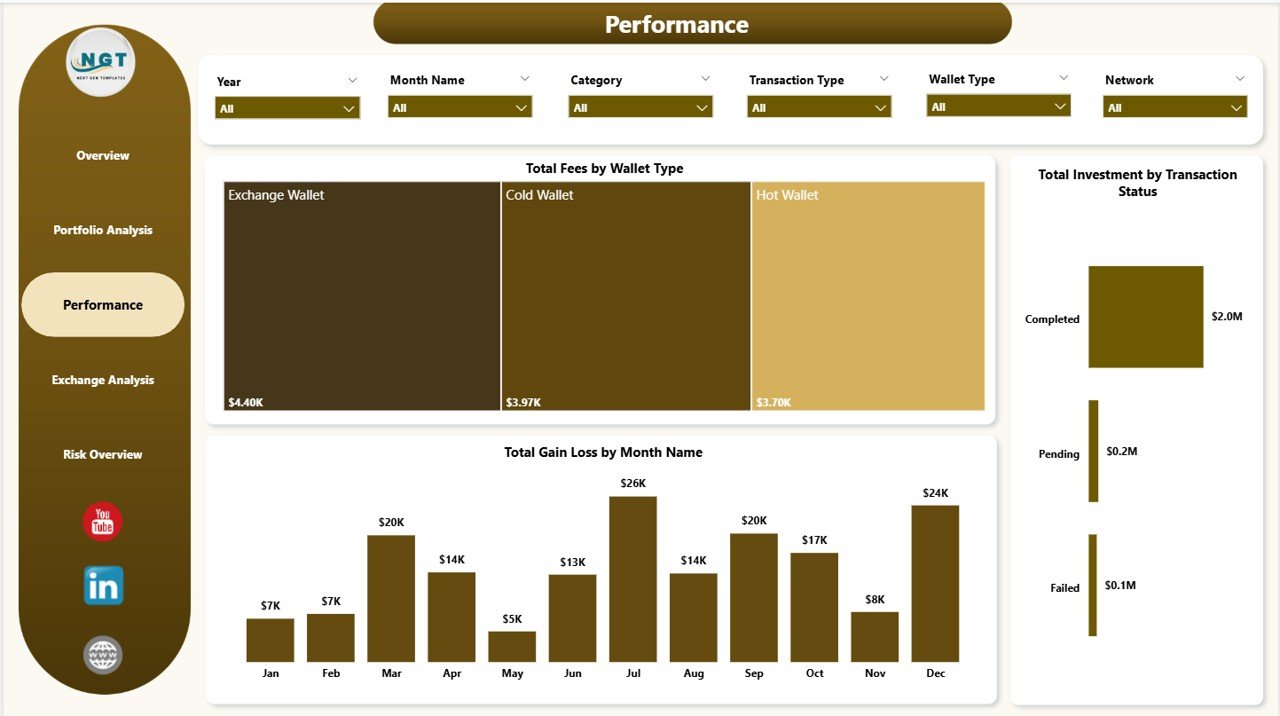
Performance
4. Exchange Analysis Page
The Exchange Analysis page is dedicated to comparing your trading activity and portfolio value across different cryptocurrency exchanges. Avg Trade Size by Exchange shows the average transaction amount on each platform, helping you understand where you make larger versus smaller trades. Total Current Value by Exchange displays how much of your portfolio value sits on each exchange, which is critical for understanding concentration risk. Total Investment by Exchange reveals your total capital deployed per platform. Together, these three charts give you a complete exchange-level picture so you can decide whether to consolidate your trading on fewer platforms or diversify further. Also explore our Crypto Portfolio Dashboard in Excel for a spreadsheet-based alternative.
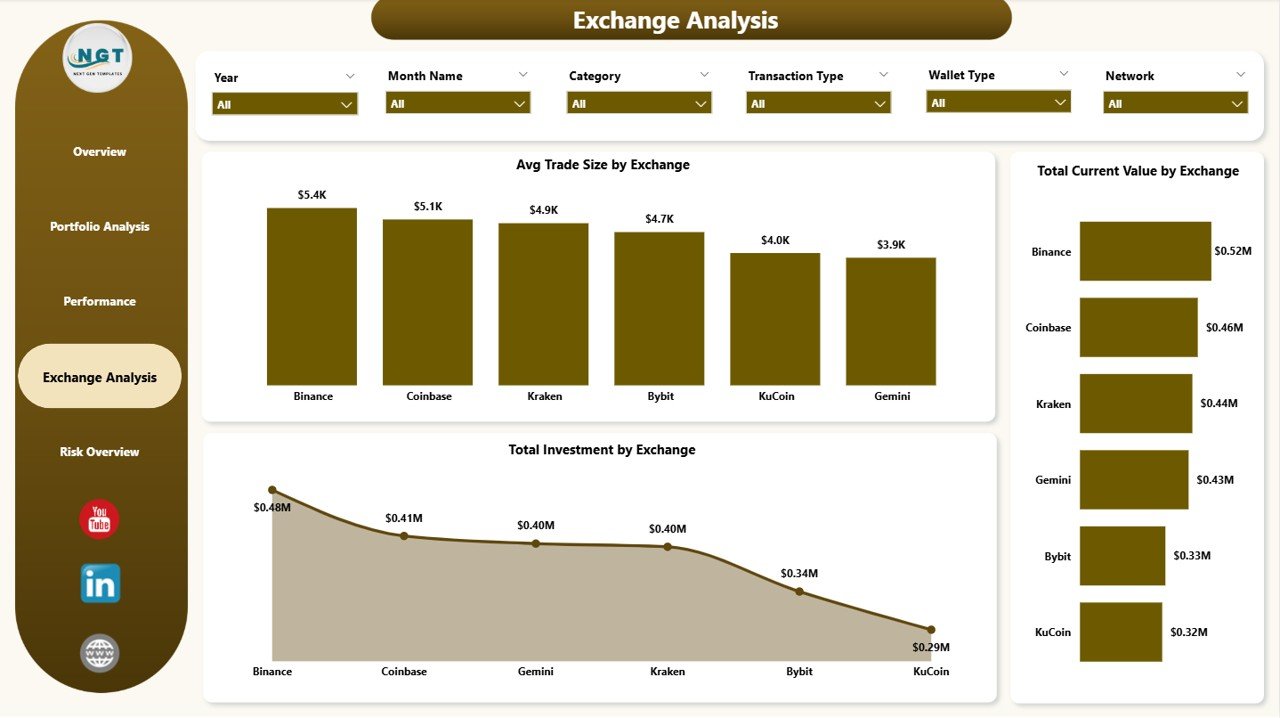
Exchange Analysis
5. Risk Overview Page
The Risk Overview page is essential for every serious crypto investor who wants to understand how risk exposure impacts returns. Total Gain Loss by Transaction Type breaks down your profits and losses by buy, sell, swap, and other transaction categories, showing which activities are most profitable. ROI by Risk Level compares the return on investment across low, medium, and high risk trades, helping you determine whether higher risk is actually delivering proportionally higher returns. Total Current Value by Risk Level shows the current portfolio value distribution across risk categories, so you can see if your portfolio is weighted too heavily toward high-risk positions. This page is a powerful tool for risk-adjusted decision making.
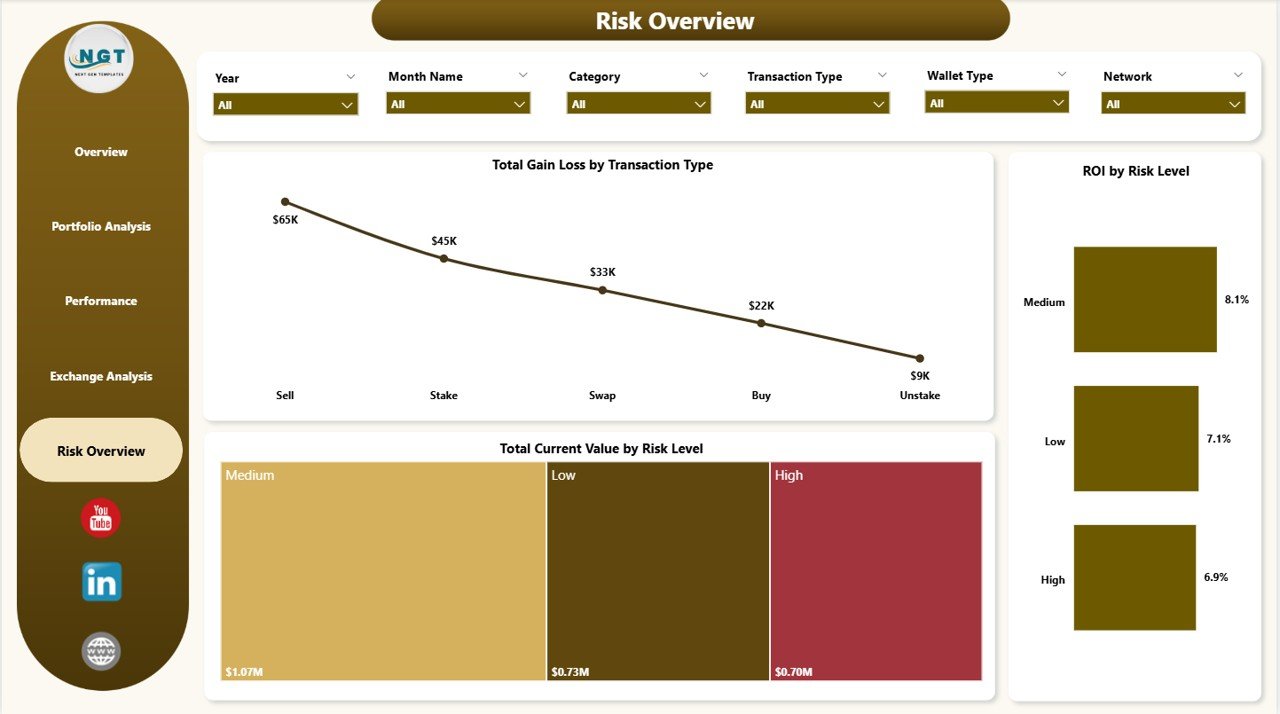
Risk Overview
Advantages of Crypto Portfolio Dashboard in Power BI
- Comprehensive 5-Page Analysis — Unlike single-page dashboards, this template covers portfolio overview, detailed analysis, performance, exchange comparison, and risk assessment in dedicated pages.
- Real-Time KPI Monitoring — KPI cards on the Overview page give you instant visibility into Total Investment, Current Value, Fees, and ROI without scrolling through data.
- Exchange-Level Granularity — Compare performance across Binance, Coinbase, Kraken, and other exchanges to optimize where you trade.
- Risk-Adjusted Insights — Dedicated risk analysis page helps you balance risk and return instead of chasing high-risk trades blindly.
- Professional Presentation Ready — Clean design suitable for personal tracking, client reporting, and executive presentations.
- Easy Data Replacement — Replace the sample data with your own crypto transactions and everything updates automatically.
Opportunities for Improvement
- Live API Integration — While the template uses static sample data, Power BI supports live API connections to exchanges like Binance and Coinbase for real-time portfolio tracking.
- DeFi Protocol Tracking — Adding pages for DeFi yield farming, staking rewards, and liquidity pool performance would expand the template for DeFi investors.
- Tax Reporting Page — A dedicated page calculating capital gains, losses, and tax liability per jurisdiction would make the dashboard even more practical for year-end tax filing.
- Alert Thresholds — Conditional formatting rules that highlight when ROI drops below a threshold or fees exceed a limit would add proactive monitoring capabilities.
Best Practices
- Update Data Regularly — Refresh your crypto transaction data weekly or monthly to keep all dashboard metrics current and accurate.
- Use Slicers Strategically — Filter by specific exchanges, risk levels, or date ranges to focus on the analysis that matters most to your current decision.
- Compare Across Exchanges — Use the Exchange Analysis page regularly to ensure you are not overconcentrated on a single platform.
- Monitor Risk Levels — Check the Risk Overview page before making new trades to ensure your portfolio maintains a healthy risk balance.
- Export for Presentations — Use Power BI’s export features to create PDF reports or share the dashboard with your financial advisor or investment group.
Explore Relevant Templates
If you found the Crypto Portfolio Dashboard in Power BI useful, explore these related templates from NextGenTemplates.com:
- Blockchain & Cryptocurrency Dashboard in Power BI — Comprehensive blockchain transaction analytics and network visualization.
- Blockchain & Cryptocurrency KPI Dashboard in Power BI — KPI scorecard focused on key blockchain performance metrics.
- Crypto Portfolio Dashboard in Excel — Excel version of this dashboard for users who prefer spreadsheets over Power BI.
- Net Worth Tracker in Excel — Track total net worth including crypto, stocks, real estate, and liabilities.
- Investment Tracker in Google Sheets — Google Sheets-based investment portfolio tracker.
Frequently Asked Questions
What KPIs does the Crypto Portfolio Dashboard in Power BI track?
The Crypto Portfolio Dashboard in Power BI tracks 5 key metrics: Total Transactions, Total Investment, Total Current Value, Total Fees, and ROI. It also includes Win Rate analysis and monthly gain/loss tracking across all 5 dashboard pages.
Do I need Power BI Pro to use this crypto dashboard template?
No. The free Power BI Desktop application from Microsoft is all you need to open, customize, and use this template. Power BI Pro is only required for publishing and sharing reports online with teams.
Can I connect this Power BI dashboard to live crypto exchange data?
Yes. Power BI supports direct connections to APIs, Excel files, CSV, SQL databases, and web data sources. You can replace the sample data with a live API feed from exchanges like Binance, Coinbase, or Kraken for real-time tracking.
What is the best Power BI template for tracking cryptocurrency investments?
The Crypto Portfolio Dashboard in Power BI from NextGenTemplates is one of the most comprehensive options available, featuring 5 dedicated pages for overview, portfolio analysis, performance tracking, exchange comparison, and risk assessment in a single .pbix file.
How do I replace the sample data with my own crypto portfolio data?
Open the .pbix file in Power BI Desktop, navigate to Transform Data in the Home ribbon, and point the data source to your own Excel, CSV, or database containing crypto transaction records. Refresh and all visuals update automatically.
Is this dashboard suitable for professional portfolio management?
Absolutely. The clean, modern design and comprehensive 5-page layout make it ideal for personal portfolio tracking, client reporting, and executive presentations. Financial analysts and portfolio managers can use the exchange analysis and risk overview pages for professional-grade insights.
Conclusion
The Crypto Portfolio Dashboard in Power BI is a powerful, professionally designed template that gives cryptocurrency investors, traders, and portfolio managers complete visibility into their digital asset portfolios. With 5 interactive pages covering overview KPIs, portfolio analysis, performance trends, exchange comparison, and risk assessment, this dashboard transforms raw crypto data into actionable insights that drive smarter investment decisions.
👉 Click here to Purchase Crypto Portfolio Dashboard in Power BI
🎥 Visit our YouTube channel for step-by-step Power BI tutorials and dashboard walkthroughs:
👉 Youtube.com/@PK-AnExcelExpert