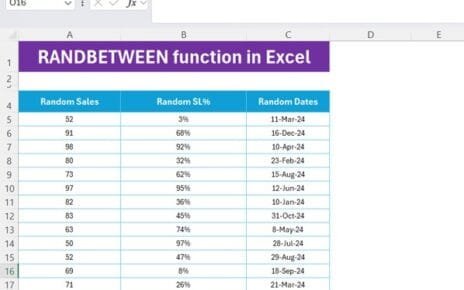
Welcome to another exciting guide where we'll explore the RANDBETWEEN function in Excel If you're looking to generate random numbers,
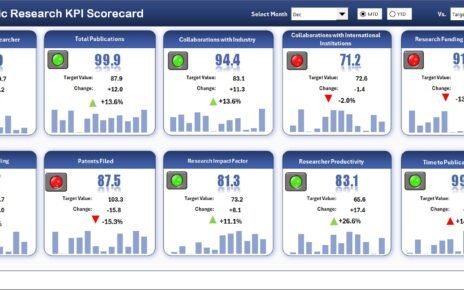
In this article we have created Scientific Research KPI Scorecard in Excel. This is a ready to use Scorecard template
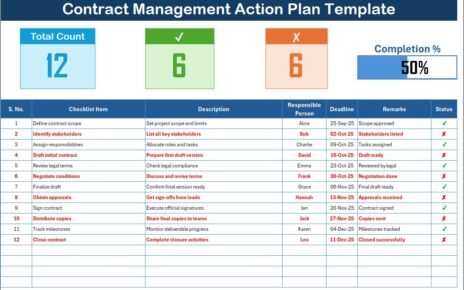
Managing contracts efficiently is one of the most critical responsibilities for businesses of any size. A contract not only defines