Data analysis is an essential aspect of any business. It helps to make informed decisions based on evidence and trends.
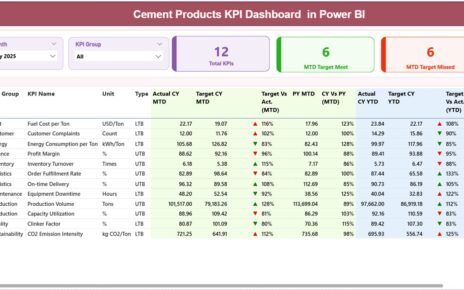
The cement manufacturing industry operates in a data-intensive environment where production efficiency, operational performance, cost management, and quality control determine
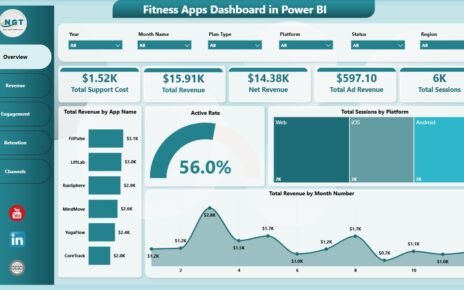
Fitness Apps Dashboard in Power BI helps app founders, wellness product teams, analysts, and subscription managers turn exported app data