Free, fair, and transparent elections build trust in democracy. However, election bodies often struggle with scattered reports, delayed updates, and manual tracking. As a result, decision-makers cannot see real-time performance.So, how can election commissions monitor key performance indicators in one centralized system?You need an Election Commissions KPI Dashboard in Power BI.This ready-to-use Power BI dashboard helps election authorities track monthly and yearly performance with clear visuals, dynamic slicers, and drill-through analysis. Moreover, it connects directly to Excel data, so teams can update numbers easily. Therefore, leaders can review targets, compare trends, and take quick action without delay.In this complete guide, you will learn:
- What the Election Commissions KPI Dashboard in Power BI is
- Why election bodies need it
- Detailed explanation of all 3 dashboard pages
- How Excel data integrates with Power BI
- Advantages of the dashboard
- Best practices for implementation
- Frequently Asked Questions with answers
Click to buy Election Commissions KPI Dashboard in Power BI
What Is the Election Commissions KPI Dashboard in Power BI?
The Election Commissions KPI Dashboard in Power BI is a ready-to-use performance monitoring solution. It tracks election-related KPIs such as voter registration progress, polling station readiness, staff training coverage, complaint resolution time, and budget utilization.
Instead of checking multiple spreadsheets, election authorities can analyze everything in one interactive dashboard. Furthermore, users can filter results by month and KPI group. Therefore, teams gain clear insights into both MTD (Month-To-Date) and YTD (Year-To-Date) performance.
Because the dashboard compares actual values with targets and previous year data, leaders can quickly identify gaps and take corrective action.
Why Do Election Commissions Need a KPI Dashboard?
Election management requires precision. However, manual tracking creates delays and confusion.
Therefore, election commissions need a KPI dashboard because:
- It provides real-time visibility.
- It improves accountability.
- It highlights performance gaps instantly.
- It supports data-driven decisions.
- It increases transparency and trust.
Moreover, when commissions track KPIs regularly, they reduce risks and improve election readiness significantly.
What Are the Key Features of the Election Commissions KPI Dashboard in Power BI?
This dashboard includes 3 powerful pages inside the Power BI Desktop file. Each page serves a clear purpose.
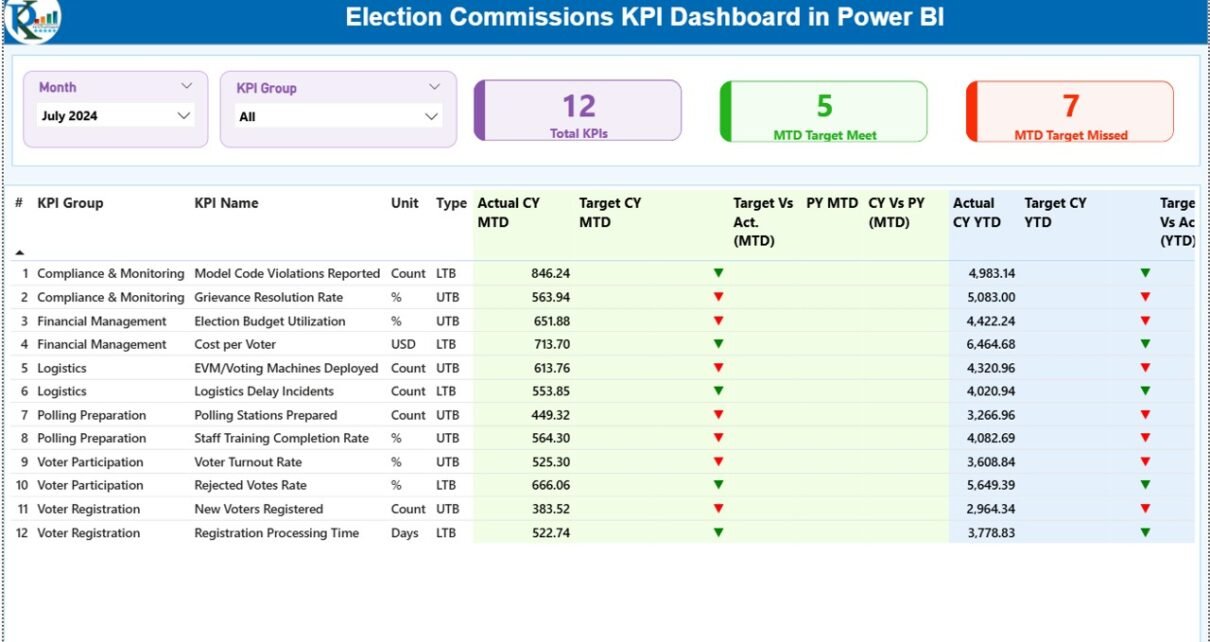
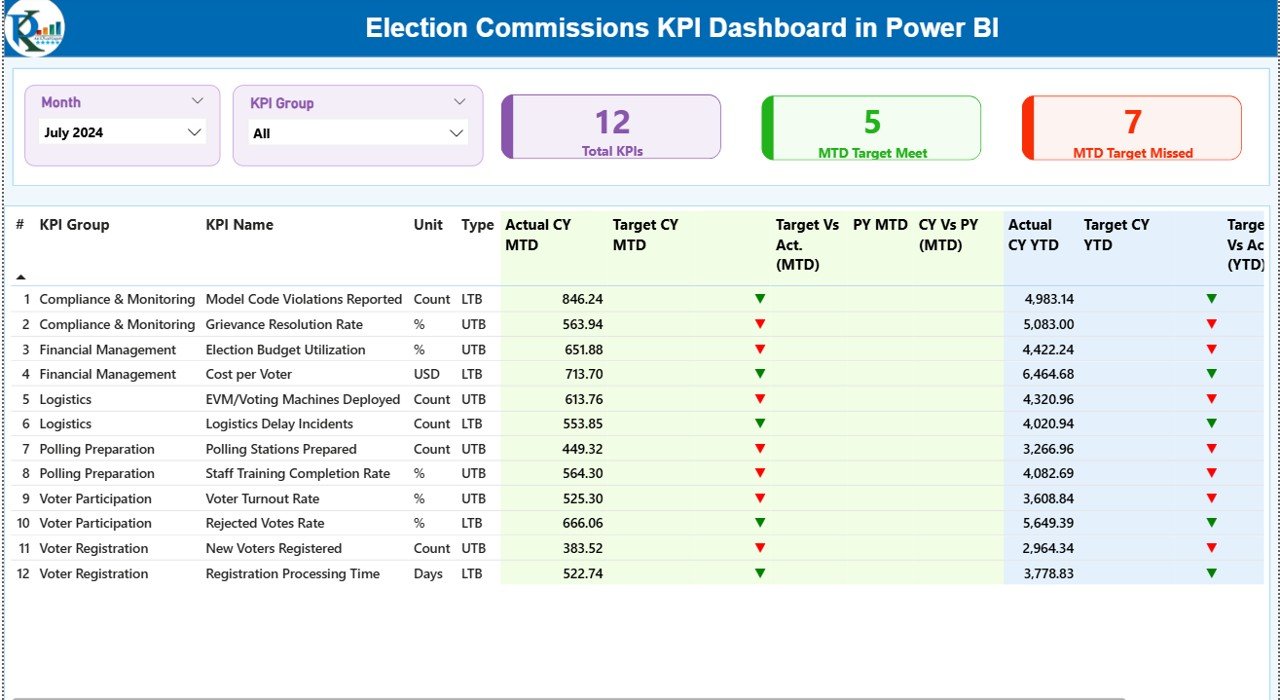
Summary Page
The Summary Page acts as the main control center.
At the top, you will see:
- Month slicer
- KPI Group slicer
These slicers allow you to filter data instantly.
KPI Cards
The dashboard displays three important KPI cards:
- Total KPIs Count
- MTD Target Meet Count
- MTD Target Missed Count
These cards immediately show overall performance status.
Detailed KPI Table
Below the cards, you will find a detailed KPI table that includes:
- KPI Number
- KPI Group
- KPI Name
- Unit
- Type (LTB – Lower the Better / UTB – Upper the Better)
- Actual CY MTD
- Target CY MTD
- MTD Status Icon (▲ Green / ▼ Red)
- Target vs Actual % (MTD)
- PY MTD
- CY vs PY % (MTD)
- Actual CY YTD
- Target CY YTD
- YTD Status Icon
- Target vs Actual % (YTD)
- PY YTD
- CY vs PY % (YTD)
For example, the dashboard calculates Target vs Actual (MTD) using:
Actual MTD / Target MTD
Similarly, it calculates Year-over-Year comparison using:
Current Year MTD / Previous Year MTD
Because of this structure, users instantly understand performance trends.
Click to buy Election Commissions KPI Dashboard in Power BI
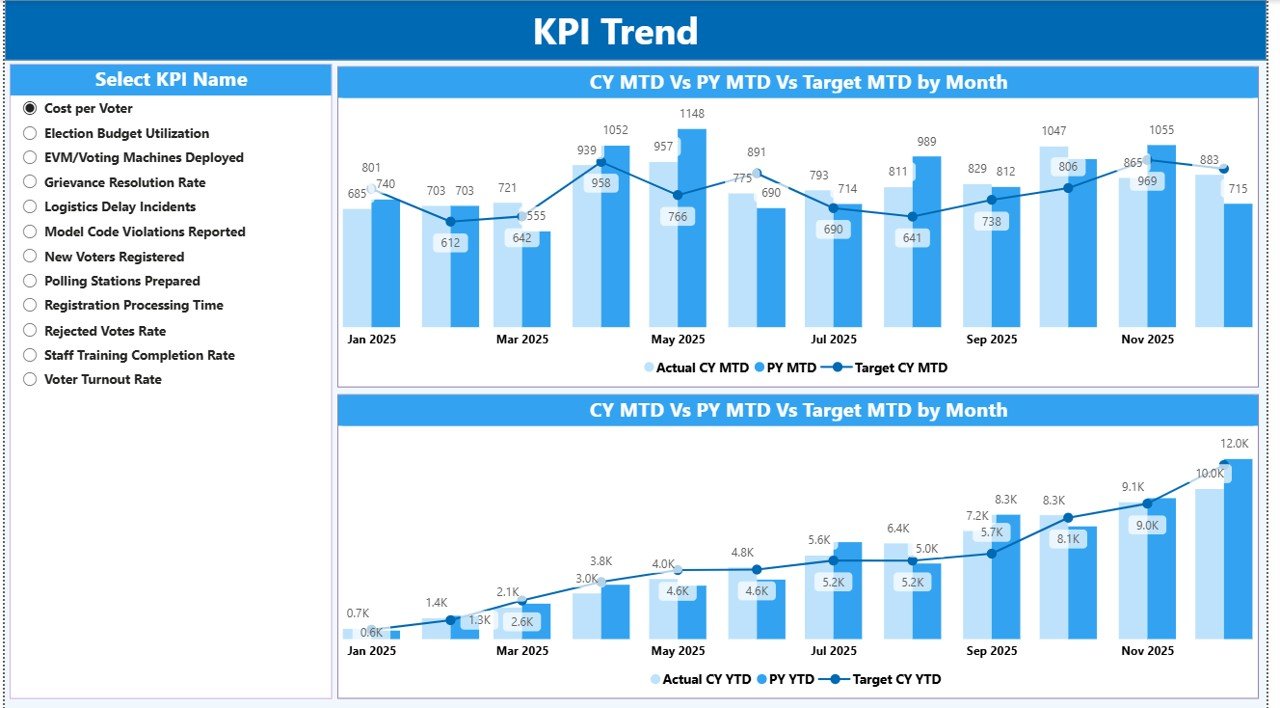
KPI Trend Page
The KPI Trend Page focuses on performance trends.
On the left side, you will find a slicer to select a specific KPI.
The page includes two combo charts:
- MTD Trend (Actual vs Target vs Previous Year)
- YTD Trend (Actual vs Target vs Previous Year)
Therefore, you can quickly analyze growth patterns and identify seasonal changes. Moreover, trend analysis helps election bodies plan resources more effectively.
Click to buy Election Commissions KPI Dashboard in Power BI
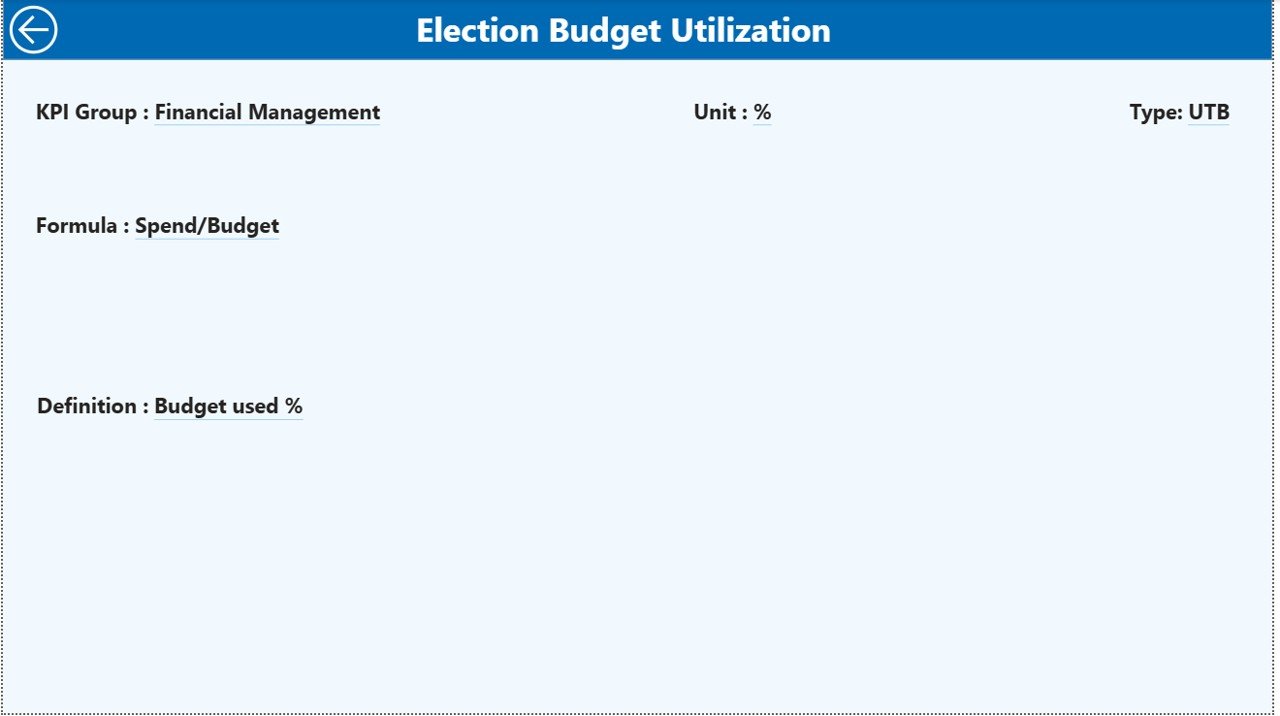
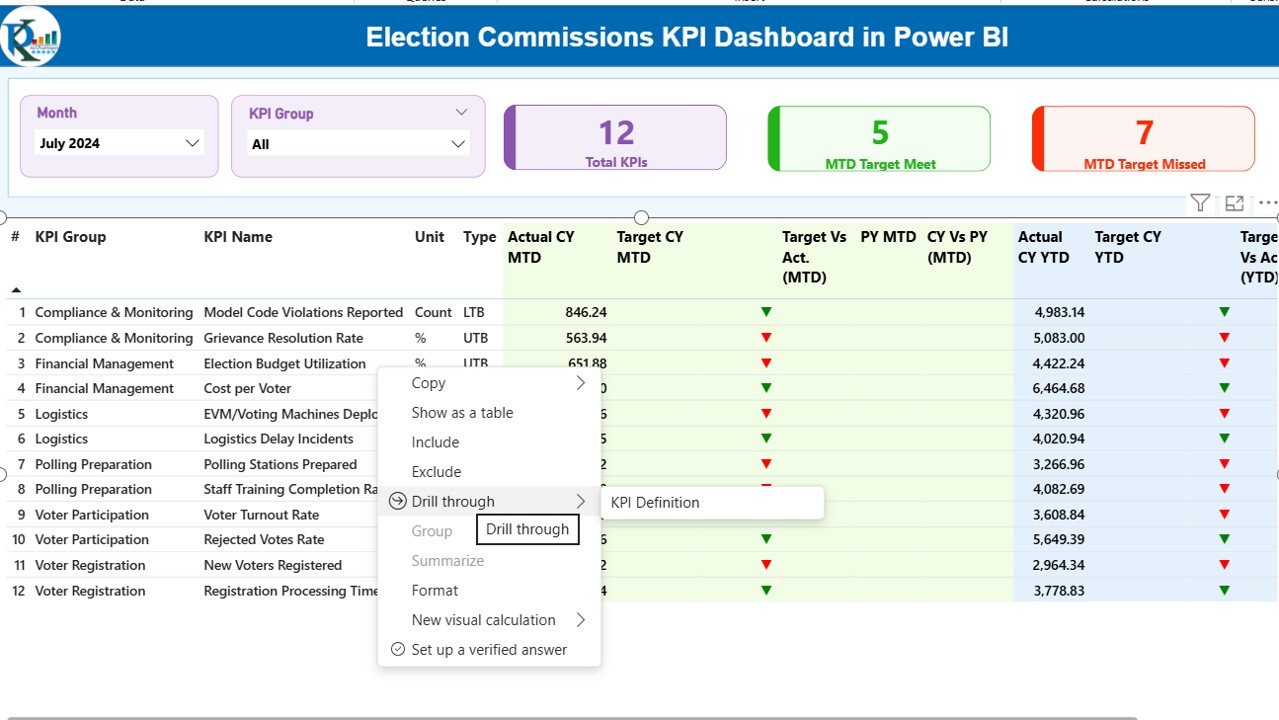
KPI Definition Page
The KPI Definition Page works as a drill-through page. Although it remains hidden, users can access it directly from the Summary page.
This page shows:
- KPI Formula
- KPI Definition
- KPI Category
- Measurement Unit
Because of this feature, users understand how each KPI works. Furthermore, this improves clarity and avoids confusion during reporting.
To return to the main page, users simply click the back button at the top left corner.
Click to buy Election Commissions KPI Dashboard in Power BI
How Does Excel Data Integrate with the Dashboard?
The dashboard connects to an Excel file as its data source. Therefore, updating data becomes simple and flexible.
The Excel file contains three worksheets:
Input_Actual Sheet
Users enter:
- KPI Name
- Month (First date of month)
- MTD numbers
- YTD numbers
Click to buy Election Commissions KPI Dashboard in Power BI
Input_Target Sheet
Users enter:
- KPI Name
- Month
- Target MTD numbers
- Target YTD numbers
KPI Definition Sheet
Users fill:
- KPI Number
- KPI Group
- KPI Name
- Unit
- Formula
- Definition
- Type (LTB or UTB)
Once users update the Excel file, Power BI refreshes automatically. As a result, leadership teams always see updated performance data.
Advantages of Election Commissions KPI Dashboard in Power BI
This dashboard offers several practical benefits.
Real-Time Monitoring
Election bodies can track MTD and YTD performance instantly.
Improved Transparency
Leaders can compare actual results against targets clearly.
Better Decision-Making
Visual charts help officials act quickly.
Strong Accountability
Color indicators highlight underperforming KPIs.
Easy Data Management
Teams update data directly in Excel without complex systems.
Trend Analysis
Year-over-Year comparison reveals long-term progress.
Because of these advantages, election commissions can operate more efficiently and confidently.
Best Practices for the Election Commissions KPI Dashboard
To maximize results, follow these best practices:
Define Clear KPIs
Choose measurable and relevant election performance indicators.
Update Data Monthly
Ensure teams update MTD and YTD numbers regularly.
Use Consistent Units
Maintain standard units across KPIs to avoid confusion.
Review Performance Meetings
Conduct monthly review meetings using the dashboard insights.
Train Staff
Train team members on Power BI navigation and KPI interpretation.
Monitor LTB vs UTB Carefully
Ensure you assign KPI types correctly because performance logic depends on it.
When teams follow these practices, the dashboard delivers accurate and meaningful insights.
Conclusion: Why Should Election Commissions Use This Dashboard?
Election management demands accuracy, speed, and transparency. However, manual spreadsheets slow down analysis.
The Election Commissions KPI Dashboard in Power BI transforms complex election data into clear, interactive visuals. Moreover, it compares actual results with targets and previous year performance. Therefore, leaders can make informed decisions quickly.
If you want better monitoring, improved accountability, and stronger election readiness, this dashboard provides the perfect solution.
Frequently Asked Questions (FAQs)
- What type of data does this dashboard require?
The dashboard requires KPI actual and target data in Excel format with monthly MTD and YTD values.
- Can I customize KPIs?
Yes. You can add, edit, or remove KPIs directly from the KPI Definition sheet.
- Does this dashboard support Year-over-Year comparison?
Yes. It compares current year performance with previous year values for both MTD and YTD.
- Is technical knowledge required to use this dashboard?
No. Users only need basic Excel knowledge to update data and basic Power BI navigation skills.
- Can election bodies use this dashboard for state or national level reporting?
Yes. The dashboard works for local, state, and national election performance monitoring.
- How often should teams refresh the dashboard?
Teams should refresh the dashboard after every monthly data update.
Visit our YouTube channel to learn step-by-step video tutorials
Watch the step-by-step video tutorial:
Click to buy Election Commissions KPI Dashboard in Power BI