An Electricity Contract Management Dashboard in Excel is a structured, interactive, and ready-to-use reporting solution that helps organizations manage electricity-related contracts efficiently. These contracts may include power purchase agreements, transmission contracts, maintenance agreements, EPC contracts, or long-term supply arrangements.
Instead of tracking electricity contracts across multiple Excel files, emails, and PDFs, this dashboard consolidates financial, operational, compliance, and performance data into one centralized Excel dashboard. As a result, decision-makers gain instant visibility, better control, and faster insights.
Moreover, because the dashboard is built in Excel, it remains flexible, cost-effective, and easy to customize without relying on expensive BI tools.
Click to Purchases Electricity Contract Management Dashboard in Excel
Why Do Organizations Need an Electricity Contract Management Dashboard?
Electricity contracts involve high value, long durations, and strict compliance requirements. Therefore, even small errors can lead to financial losses, disputes, or regulatory penalties.
However, many organizations still rely on manual spreadsheets. As a result, they face challenges such as:
-
Poor visibility into contract profitability
-
Delayed payments and outstanding amounts
-
Missed SLA or compliance deadlines
-
Difficulty analyzing contract types, regions, or procurement methods
-
Slow and error-prone reporting
An Electricity Contract Management Dashboard in Excel solves these problems by converting raw contract data into visual, structured, and decision-ready insights.
How Does the Electricity Contract Management Dashboard in Excel Work?
The dashboard works on a simple yet powerful concept.
First, users maintain structured contract data in a Data Sheet. Then, Excel formulas, Pivot Tables, and charts process that data automatically. Finally, interactive slicers and visuals present insights across multiple analytical pages.
Because everything runs inside Excel, users can update data easily and see results instantly.
Click to Purchases Electricity Contract Management Dashboard in Excel
Key Features of the Electricity Contract Management Dashboard in Excel
This ready-to-use dashboard includes five powerful analytical pages, along with supporting data sheets. Each page focuses on a specific decision-making angle.
What Does the Page Navigator Do?
The Page Navigator, located on the left side, allows users to move smoothly across different dashboard pages.
Because of this feature:
-
Navigation becomes fast and intuitive
-
Users avoid confusion while presenting data
-
Stakeholders can jump directly to the required analysis
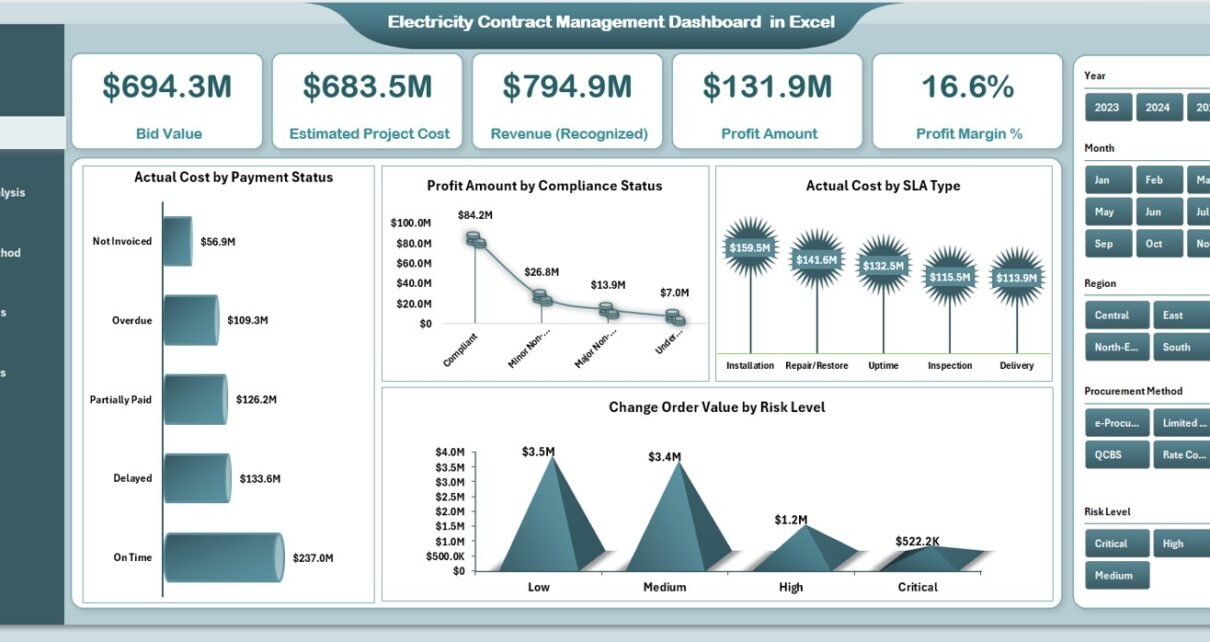
Overview Page – What Insights Does It Provide?
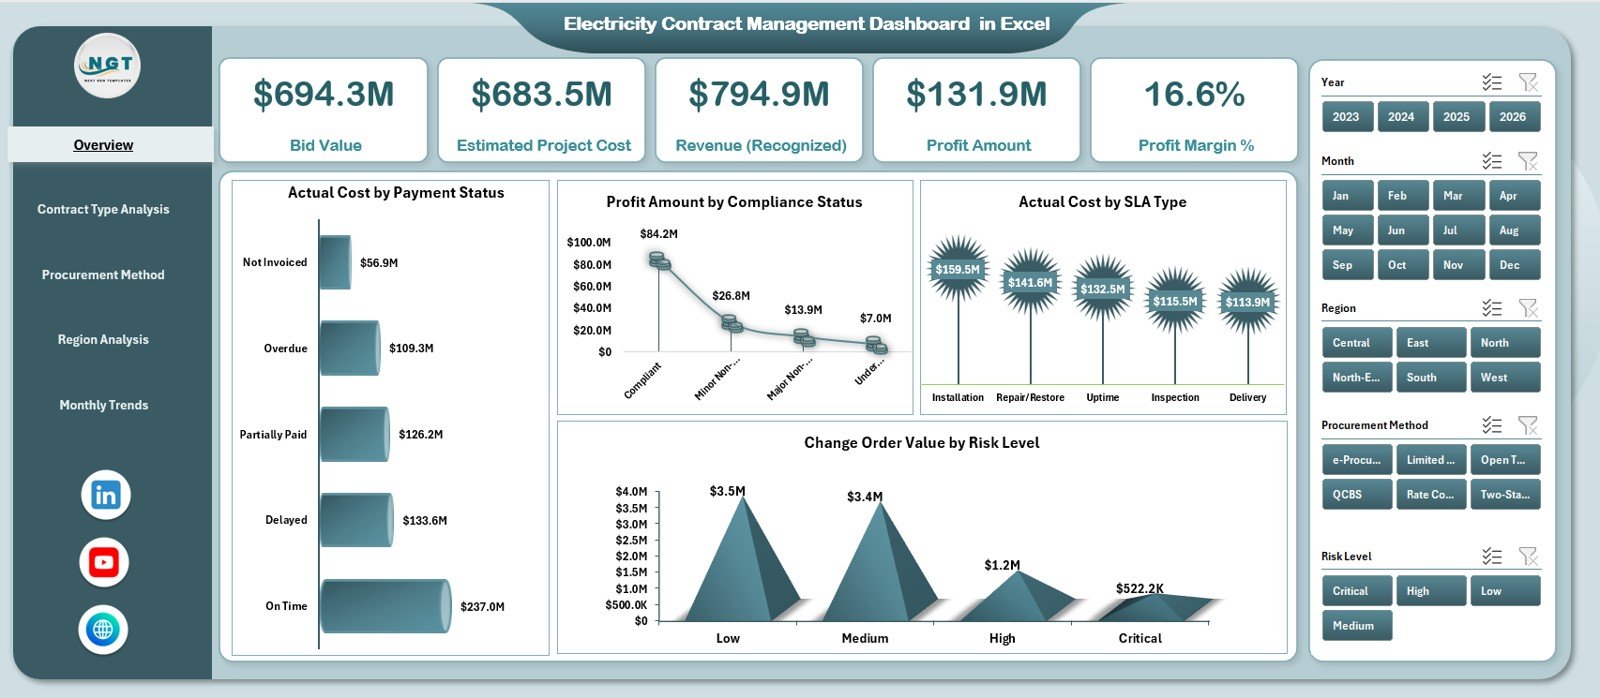
The Overview Page serves as the executive summary of the dashboard. It provides high-level financial and operational clarity at a glance.
KPI Cards on the Overview Page
This page contains five KPI cards:
-
Bid Value – Total contracted bid amount
-
Estimated Project Cost – Planned cost of electricity contracts
-
Revenue (Recognized) – Actual recognized revenue
-
Profit Amount – Revenue minus actual cost
-
Profit Margin % – Profit as a percentage of revenue
These KPIs help leadership quickly understand overall performance.
Charts on the Overview Page
In addition, the Overview Page includes four insightful charts:
-
Actual Cost by Payment Status – Tracks paid vs unpaid costs
-
Profit Amount by Compliance Status – Shows impact of compliance on profitability
-
Actual Cost by SLA Type – Analyzes cost distribution by SLA agreements
-
Change Order Value by Risk Level – Highlights financial risk exposure
Because these visuals update dynamically, users can identify risks and opportunities instantly.
Contract Type Analysis – How Do Different Contracts Perform?
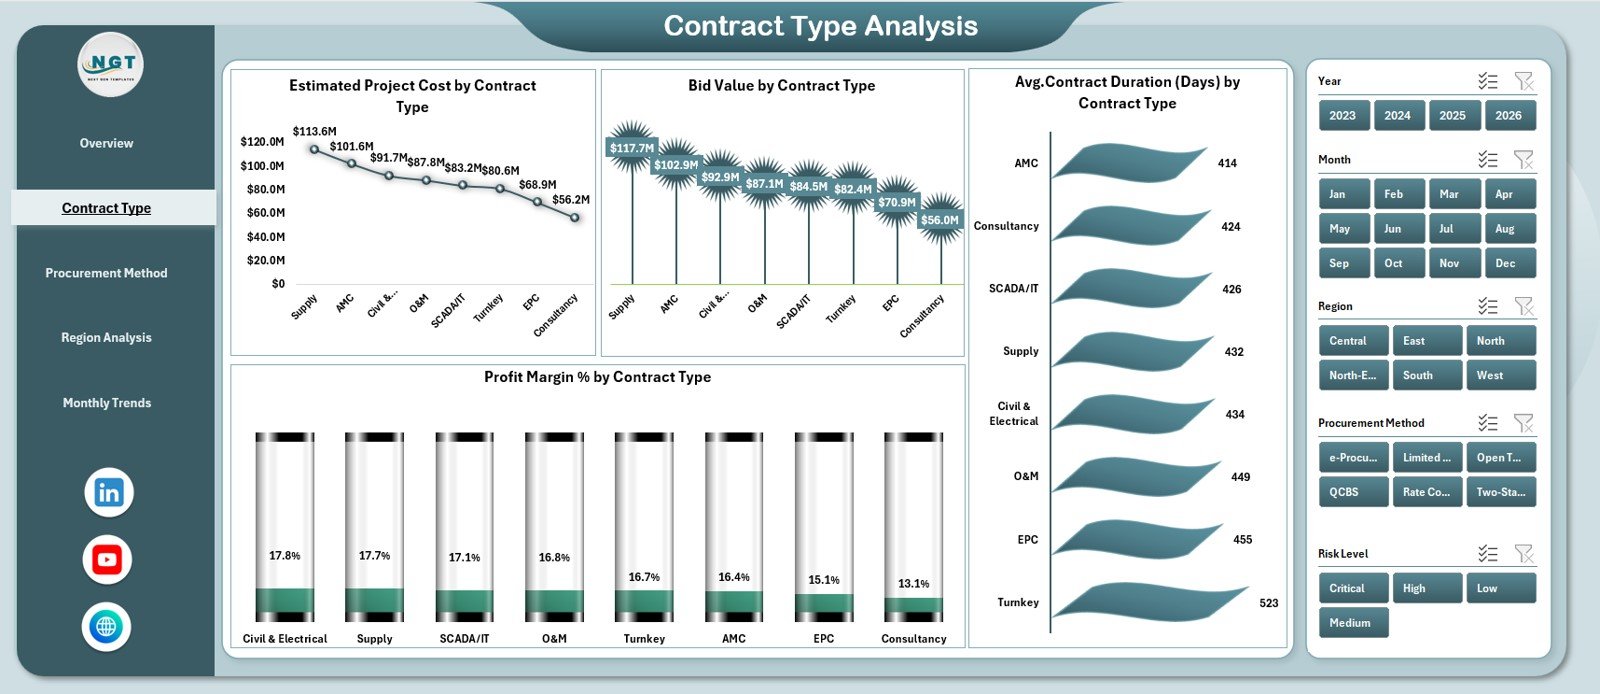
The Contract Type Analysis Page focuses on performance across various electricity contract types.
Key Charts in Contract Type Analysis
This page includes four charts:
-
Estimated Project Cost by Contract Type
-
Bid Value by Contract Type
-
Profit Margin % by Contract Type
-
Average Contract Duration (Days) by Contract Type
Through this analysis, organizations can quickly identify:
-
Which contract types generate higher margins
-
Which contracts carry longer commitments
-
Where cost overruns frequently occur
As a result, teams can refine contract strategies effectively.
Click to Purchases Electricity Contract Management Dashboard in Excel
Procurement Method Analysis – Which Procurement Approach Works Best?
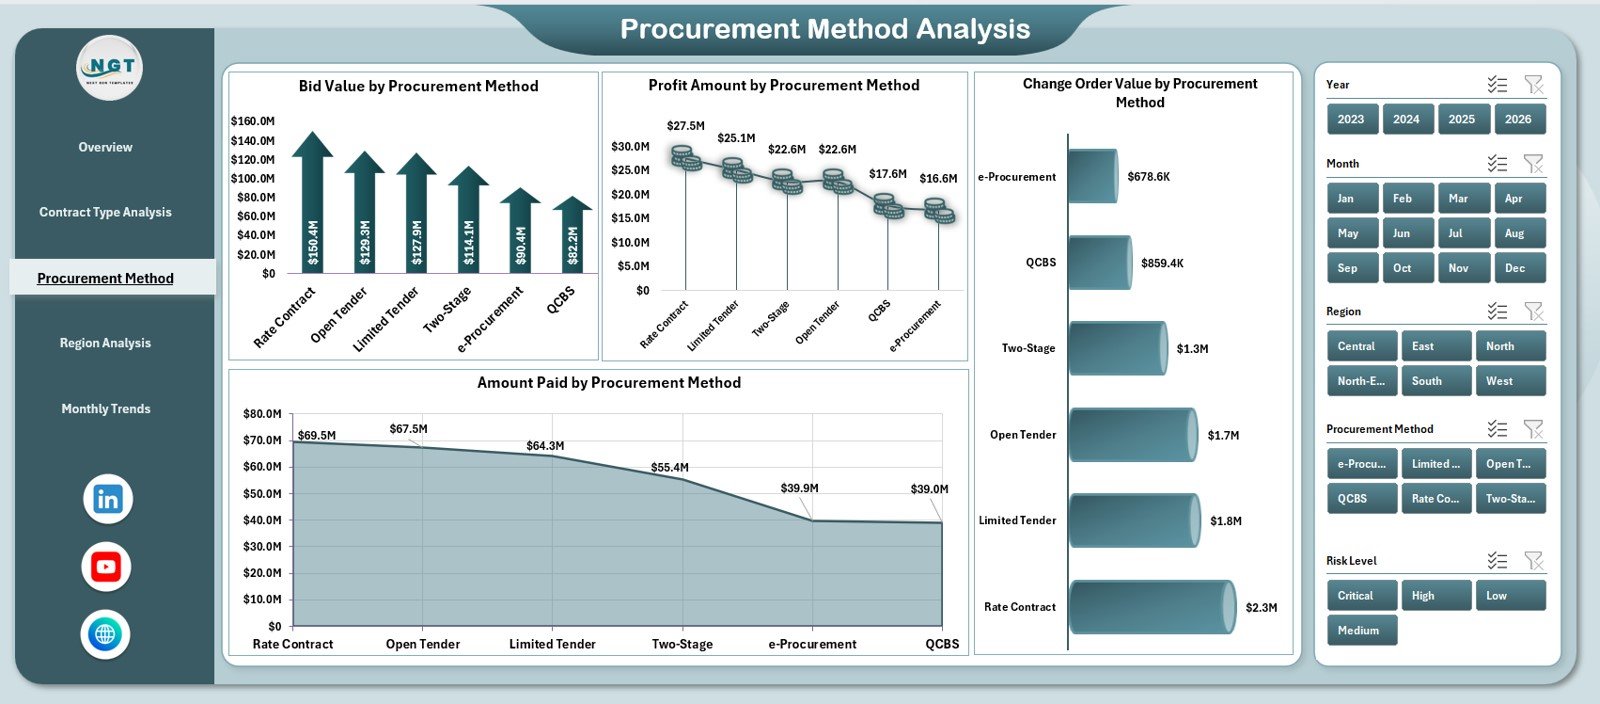
Electricity contracts often follow different procurement methods such as open bidding, negotiated contracts, or framework agreements.
The Procurement Method Analysis Page evaluates performance by procurement approach.
Key Charts in Procurement Method Analysis
This page contains four charts:
-
Bid Value by Procurement Method
-
Profit Amount by Procurement Method
-
Change Order Value by Procurement Method
-
Amount Paid by Procurement Method
Because of this analysis, procurement teams can:
-
Compare profitability across methods
-
Identify methods with frequent change orders
-
Improve future procurement decisions
Region Analysis – How Do Electricity Contracts Perform Region-Wise?
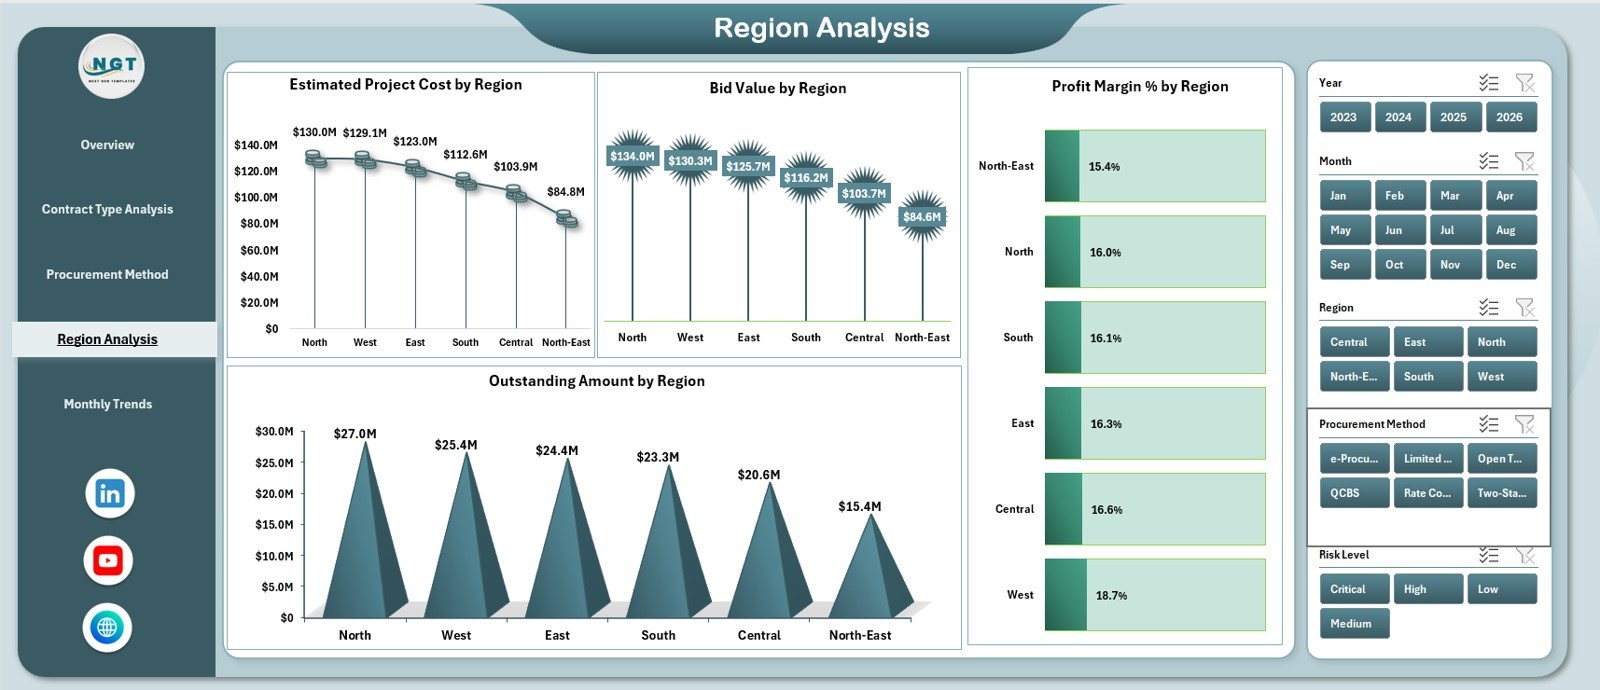
Electricity contracts often span multiple regions. Therefore, geographic analysis becomes essential.
The Region Analysis Page provides this insight clearly.
Key Charts in Region Analysis
This page includes four charts:
-
Estimated Project Cost by Region
-
Bid Value by Region
-
Profit Margin % by Region
-
Outstanding Amount by Region
Using these visuals, organizations can:
-
Detect regional cost inefficiencies
-
Monitor outstanding payments by location
-
Optimize regional contract strategies
Monthly Trends – How Is Performance Changing Over Time?
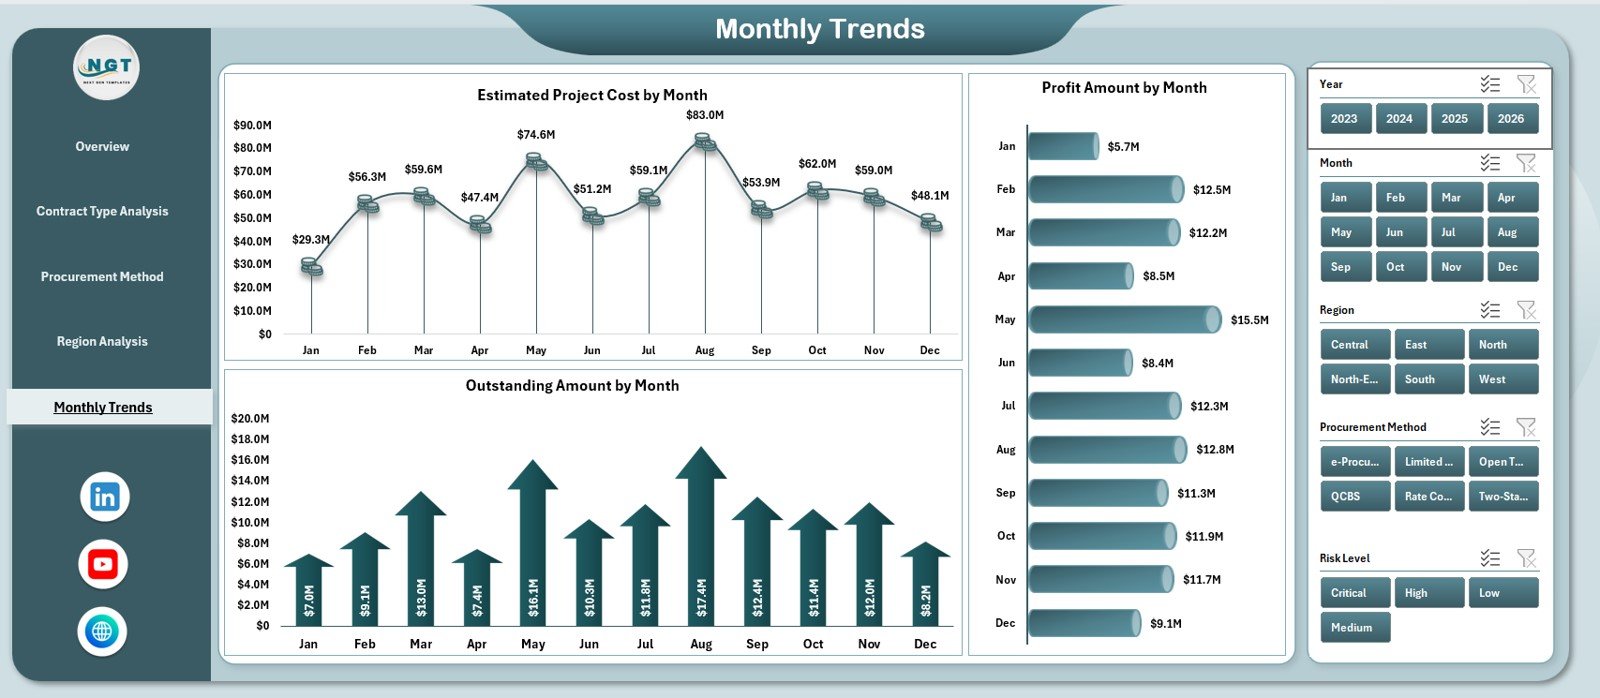
Trends reveal patterns that static numbers cannot. That is why the Monthly Trends Page plays a crucial role.
Key Charts in Monthly Trends
This page contains three charts:
-
Estimated Project Cost by Month
-
Profit Amount by Month
-
Outstanding Amount by Month
Through this analysis, management can:
-
Track seasonal cost fluctuations
-
Monitor profitability trends
-
Control outstanding balances proactively
What Are the Support Sheet and Data Sheet Used For?
Data Sheet
The Data Sheet stores all raw contract-level information such as:
-
Contract ID
-
Contract Type
-
Region
-
Procurement Method
-
Bid Value
-
Estimated Cost
-
Actual Cost
-
Revenue
-
Payment Status
-
Compliance Status
-
SLA Type
-
Risk Level
-
Contract Start and End Dates
Because data remains structured, analysis stays accurate and scalable.
Support Sheet
The Support Sheet manages dropdown lists, validations, and helper tables. As a result, data entry becomes consistent and error-free.
Click to Purchases Electricity Contract Management Dashboard in Excel
Advantages of Electricity Contract Management Dashboard in Excel
Using this dashboard delivers multiple strategic advantages.
1. Centralized Contract Visibility
All electricity contracts appear in one place. Therefore, teams avoid scattered data.
2. Faster Decision-Making
Interactive visuals enable instant insights. As a result, leadership acts quickly.
3. Improved Profitability Control
Clear profit and margin analysis helps optimize contract performance.
4. Better Risk Management
Risk-level and compliance analysis highlights potential issues early.
5. Cost-Effective Solution
Excel eliminates the need for expensive BI platforms.
6. Easy Customization
Users can modify charts, KPIs, and formulas easily.
Opportunities for Improvement Using This Dashboard
Even a strong dashboard opens doors for improvement.
-
Add contract renewal alerts using conditional formatting
-
Introduce vendor performance scoring
-
Integrate forecast vs actual cost tracking
-
Add penalty and incentive calculations
-
Connect with Power Query for automated data refresh
By expanding these features, organizations can increase dashboard value further.
Best Practices for the Electricity Contract Management Dashboard in Excel
Following best practices ensures long-term success.
Maintain Clean Data
Always validate entries using dropdowns and rules.
Update Data Regularly
Schedule weekly or monthly updates to keep insights fresh.
Use Consistent Naming
Standardize contract types, regions, and procurement methods.
Monitor Profit Margins Closely
Focus on declining margins and investigate causes early.
Secure the Workbook
Protect formulas and structure to avoid accidental changes.
Train Key Users
Ensure teams understand slicers, filters, and KPIs.
Click to Purchases Electricity Contract Management Dashboard in Excel
Who Can Use This Electricity Contract Management Dashboard?
This dashboard suits a wide range of professionals:
-
Electricity utilities
-
Power generation companies
-
EPC contractors
-
Energy procurement teams
-
Finance and accounting departments
-
Contract and compliance managers
Conclusion – Why This Dashboard Matters
Managing electricity contracts without visibility creates risk, inefficiency, and lost profit. However, the Electricity Contract Management Dashboard in Excel transforms complex contract data into clear, actionable insights.
Because it combines financial KPIs, operational analysis, and trend tracking in one Excel file, organizations gain control, clarity, and confidence. Moreover, its flexibility ensures long-term usability across projects and regions.
In short, this dashboard turns Excel into a powerful contract intelligence tool.
Frequently Asked Questions (FAQs)
1. What is an Electricity Contract Management Dashboard in Excel?
It is an Excel-based dashboard that tracks financial, operational, and compliance performance of electricity contracts.
2. Do I need advanced Excel skills to use this dashboard?
No. Basic Excel knowledge works well because the dashboard is ready to use.
3. Can I customize the dashboard?
Yes. You can modify KPIs, charts, and formulas easily.
4. How many contracts can this dashboard handle?
Excel supports thousands of records, so the dashboard scales well.
5. Is this dashboard suitable for audits?
Yes. Centralized and structured data supports audit and compliance reviews.
6. Can I add more analytical pages?
Yes. You can extend the dashboard with additional Pivot Tables and charts.
Click to Purchases Electricity Contract Management Dashboard in Excel
Visit our YouTube channel to learn step-by-step video tutorials