Managing electricity contracts is never simple. Organizations must track bid values, estimated project costs, revenues, profits, risks, compliance, and timelines at the same time. However, when contract data stays scattered across spreadsheets or manual reports, teams lose visibility. As a result, decisions slow down, risks increase, and profitability suffers.
That is exactly where an Electricity Contract Management Dashboard in Power BI becomes a powerful solution. It converts complex contract data into clear visuals, interactive KPIs, and actionable insights. Moreover, it helps management teams monitor performance, control costs, and improve compliance from a single dashboard.
In this detailed article, you will learn what an Electricity Contract Management Dashboard in Power BI is, how it works, why it matters, its complete dashboard structure, advantages, opportunities for improvement, best practices, and frequently asked questions. Additionally, the language stays simple, practical, and business-focused so you can apply these ideas easily.
Click to Purchases Electricity Contract Management Dashboard in Power BI
What Is an Electricity Contract Management Dashboard in Power BI?
An Electricity Contract Management Dashboard in Power BI is an interactive reporting solution that tracks and analyzes electricity contract performance using real-time visuals and KPIs.
Instead of reviewing thousands of rows in Excel, users can instantly see:
-
Financial performance
-
Contract risks
-
Compliance status
-
Regional trends
-
Monthly progress
Because Power BI updates visuals dynamically, decision-makers always see the latest information. Therefore, finance teams, procurement managers, project managers, and leadership teams gain clarity and control.
Why Do Electricity Companies Need a Contract Management Dashboard?
Electricity contracts involve high values and long durations. Even small inefficiencies can lead to large losses. Therefore, organizations need a centralized system to monitor every aspect of contract performance.
Key reasons include:
-
To track bid value vs actual performance
-
To monitor cost overruns and change orders
-
To analyze profit margins across contract types
-
To ensure SLA and compliance adherence
-
To identify regional and monthly trends
Because Power BI provides interactive filtering, teams can drill down instantly. As a result, issues surface early, and corrective actions become faster.
Click to Purchases Electricity Contract Management Dashboard in Power BI
How Does an Electricity Contract Management Dashboard in Power BI Work?
The dashboard connects to structured contract data sources such as Excel files, databases, or ERP systems. After that, Power BI transforms the data into visuals using relationships, measures, and slicers.
Typical workflow:
-
Load electricity contract data into Power BI
-
Clean and transform data using Power Query
-
Create calculated measures for KPIs
-
Design visuals and interactive slicers
-
Publish and share insights securely
Because Power BI works with refresh schedules, the dashboard always reflects updated contract performance.
KPIs form the foundation of this dashboard. They summarize complex data into meaningful numbers.
Core KPI Cards on the Overview Page:
-
Bid Value – Total value of awarded contracts
-
Estimated Project Cost – Planned cost before execution
-
Revenue (Recognized) – Revenue booked till date
-
Profit Amount – Revenue minus actual cost
-
Profit Margin % – Profit as a percentage of revenue
Because these KPIs update with slicers, users can analyze performance by region, contract type, or time period.
What Is the Structure of the Electricity Contract Management Dashboard in Power BI?
This dashboard includes five well-structured pages, each focusing on a specific analytical angle. Together, they provide a complete view of contract performance.
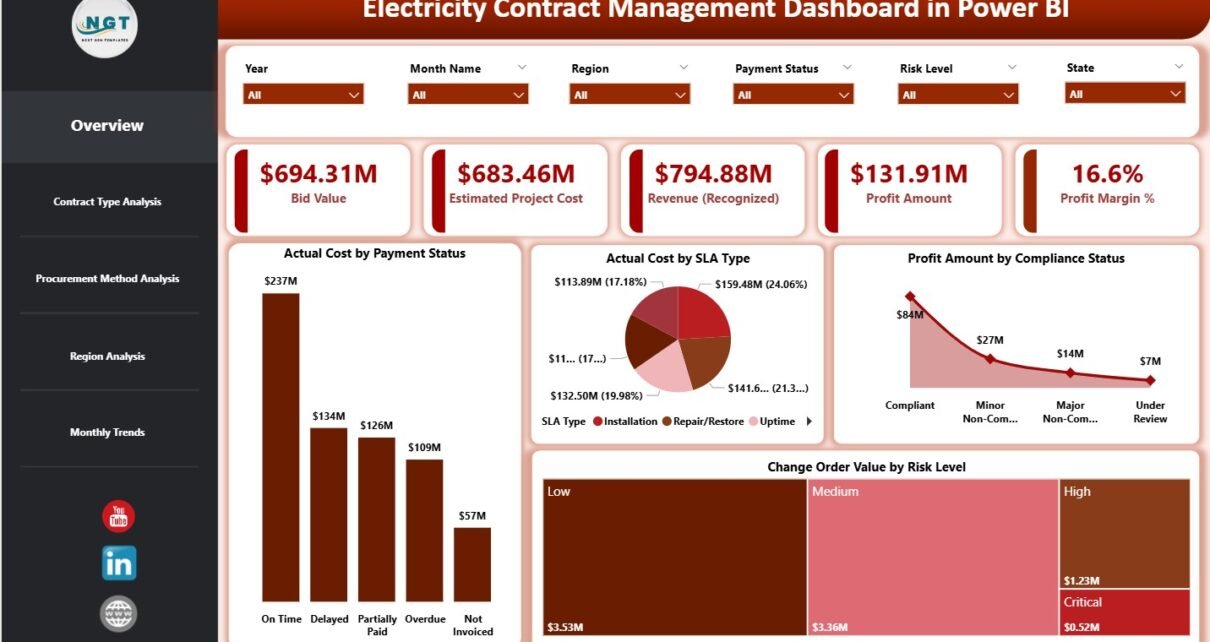
What Insights Does the Overview Page Provide?
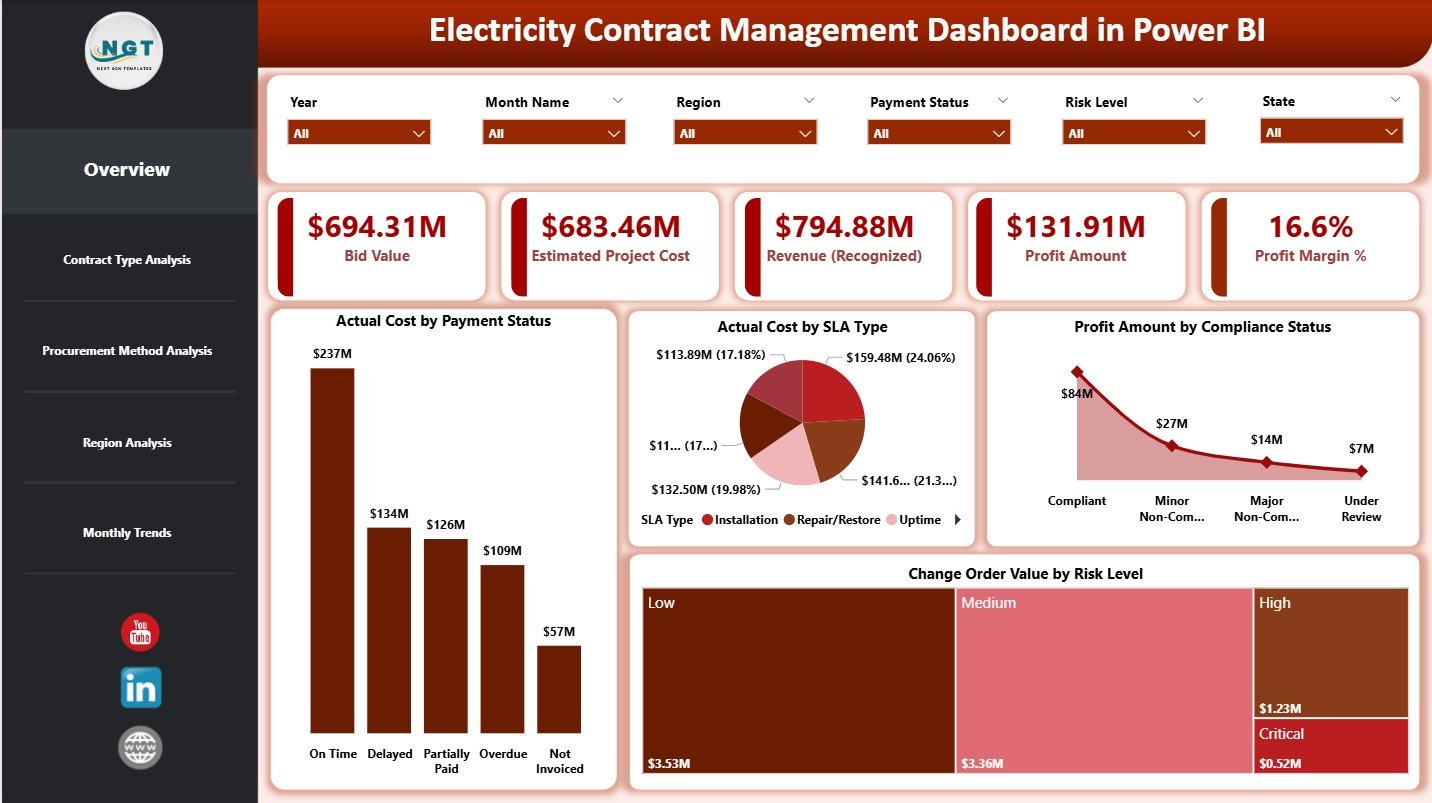
The Overview Page acts as the control center of the dashboard. It highlights overall financial health and risk distribution.
Key Features:
-
Interactive slicers for quick filtering
-
Five KPI cards for high-level performance
-
Four analytical charts for deeper insights
Charts on the Overview Page:
-
Actual Cost by Payment Status
Shows paid, pending, and overdue costs -
Actual Cost by SLA Type
Highlights cost distribution across SLA categories -
Profit Amount by Compliance Status
Reveals how compliance affects profitability -
Change Order Value by Risk Level
Identifies high-risk contracts with frequent changes
Because this page summarizes everything, leadership teams often start their analysis here.
How Does Contract Type Analysis Improve Decision-Making?
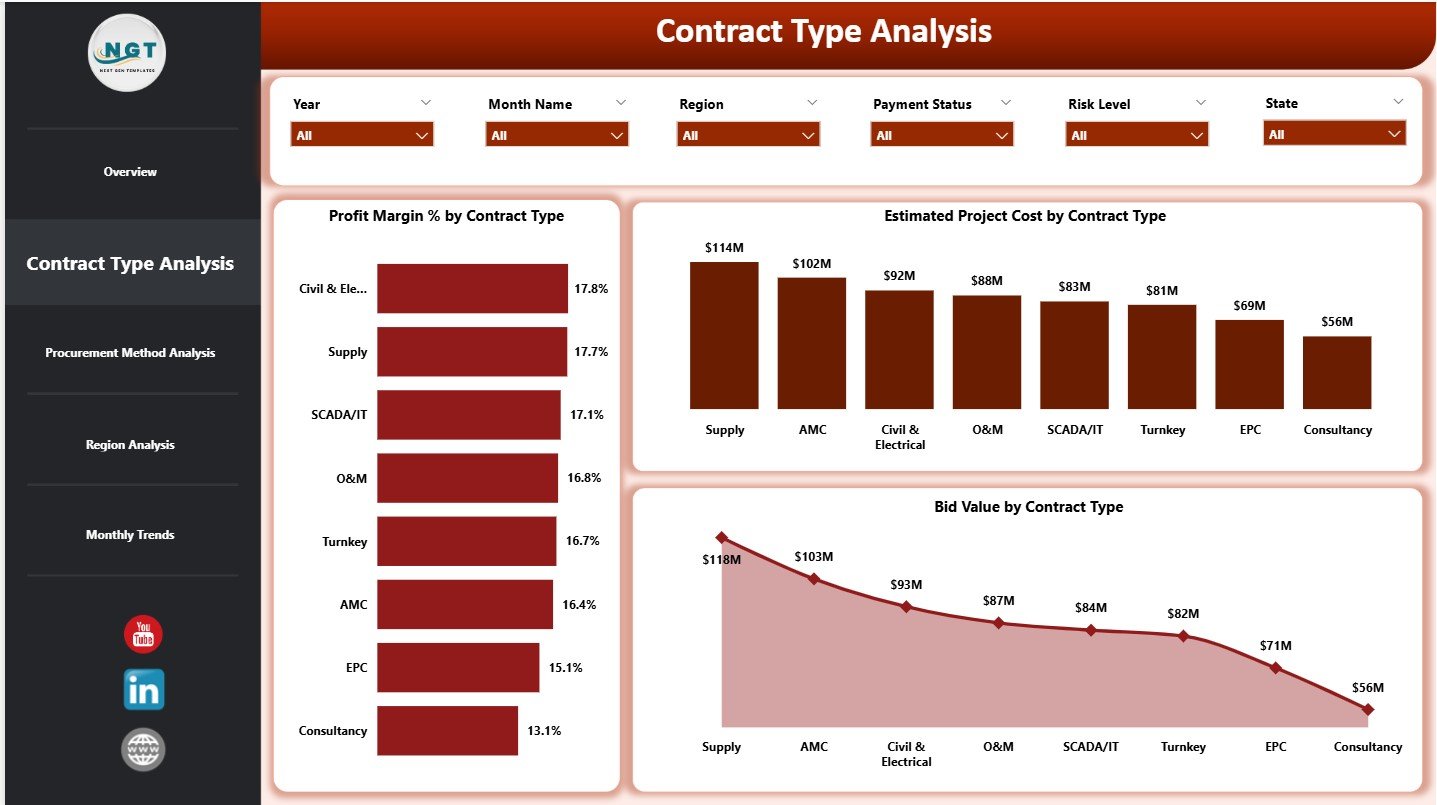
The Contract Type Analysis Page focuses on comparing performance across different contract models.
Key Charts:
-
Profit Margin % by Contract Type
Helps identify the most profitable contract structures -
Estimated Project Cost by Contract Type
Reveals cost-heavy contract categories -
Bid Value by Contract Type
Shows revenue concentration by contract type
Because contract types behave differently, this page helps organizations refine their bidding and negotiation strategies.
Why Is Procurement Method Analysis Important?
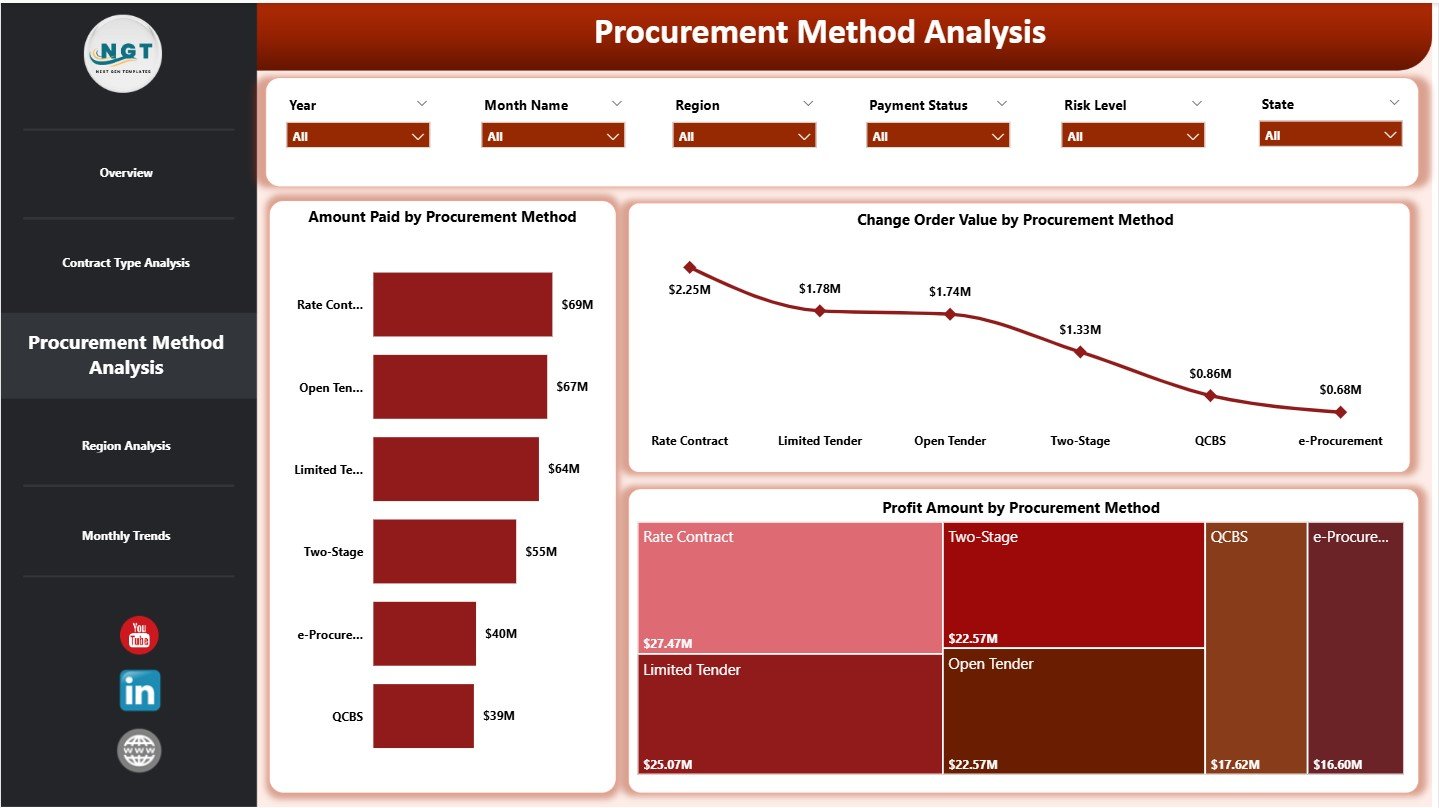
Procurement methods directly impact cost efficiency and profitability. Therefore, this page evaluates performance across procurement strategies.
Procurement Method Analysis Charts:
-
Amount Paid by Procurement Method
Shows spending distribution -
Change Order Value by Procurement Method
Highlights procurement methods with frequent changes -
Profit Amount by Procurement Method
Identifies the most profitable procurement approaches
As a result, procurement teams can standardize processes that deliver better margins.
How Does Region Analysis Support Strategic Planning?
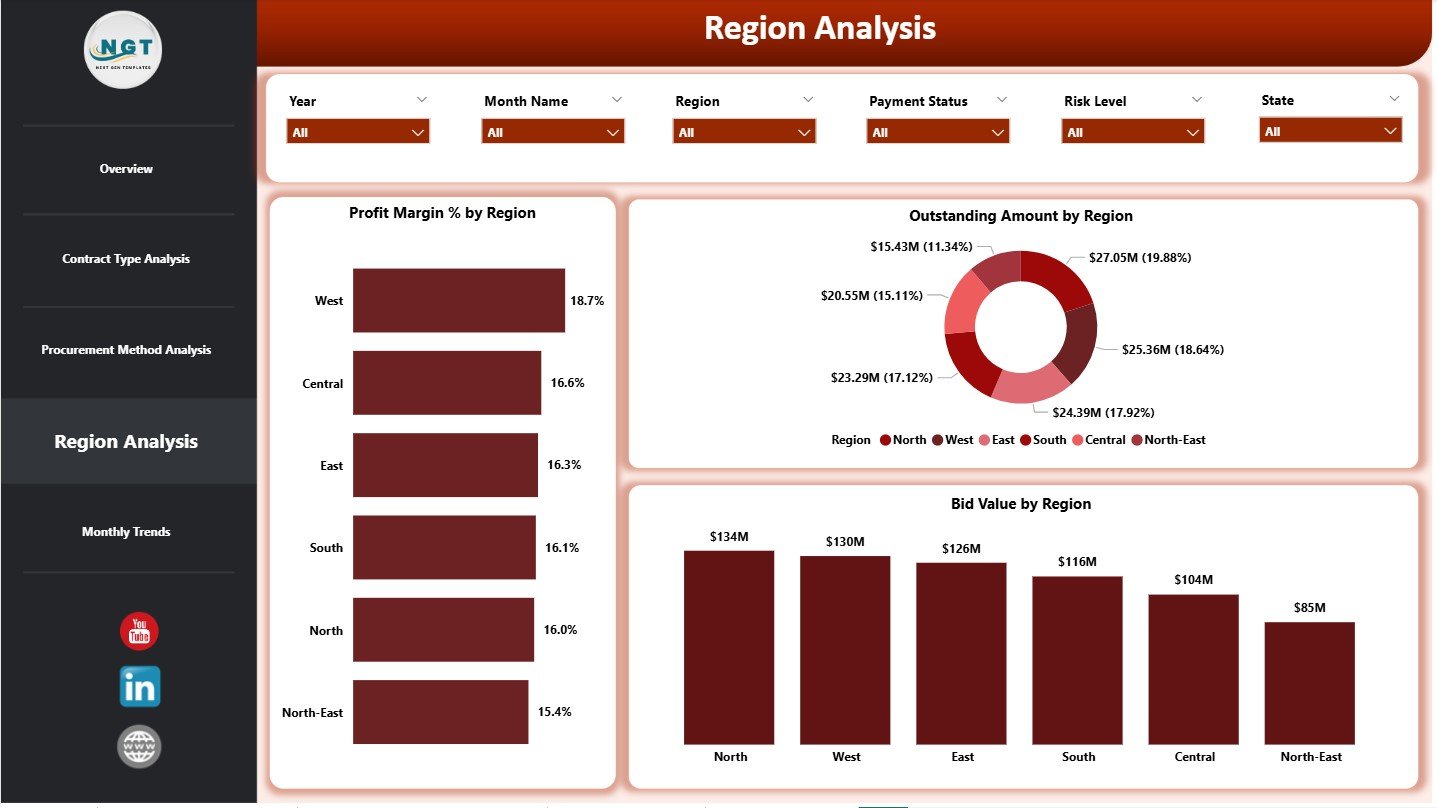
Electricity contracts often span multiple regions. However, not all regions perform equally.
Region Analysis Page Includes:
-
Profit Margin % by Region
-
Outstanding Amount by Region
-
Bid Value by Region
Because regional performance varies due to regulations, infrastructure, and market conditions, this page helps leadership allocate resources wisely.
What Trends Does the Monthly Trends Page Reveal?
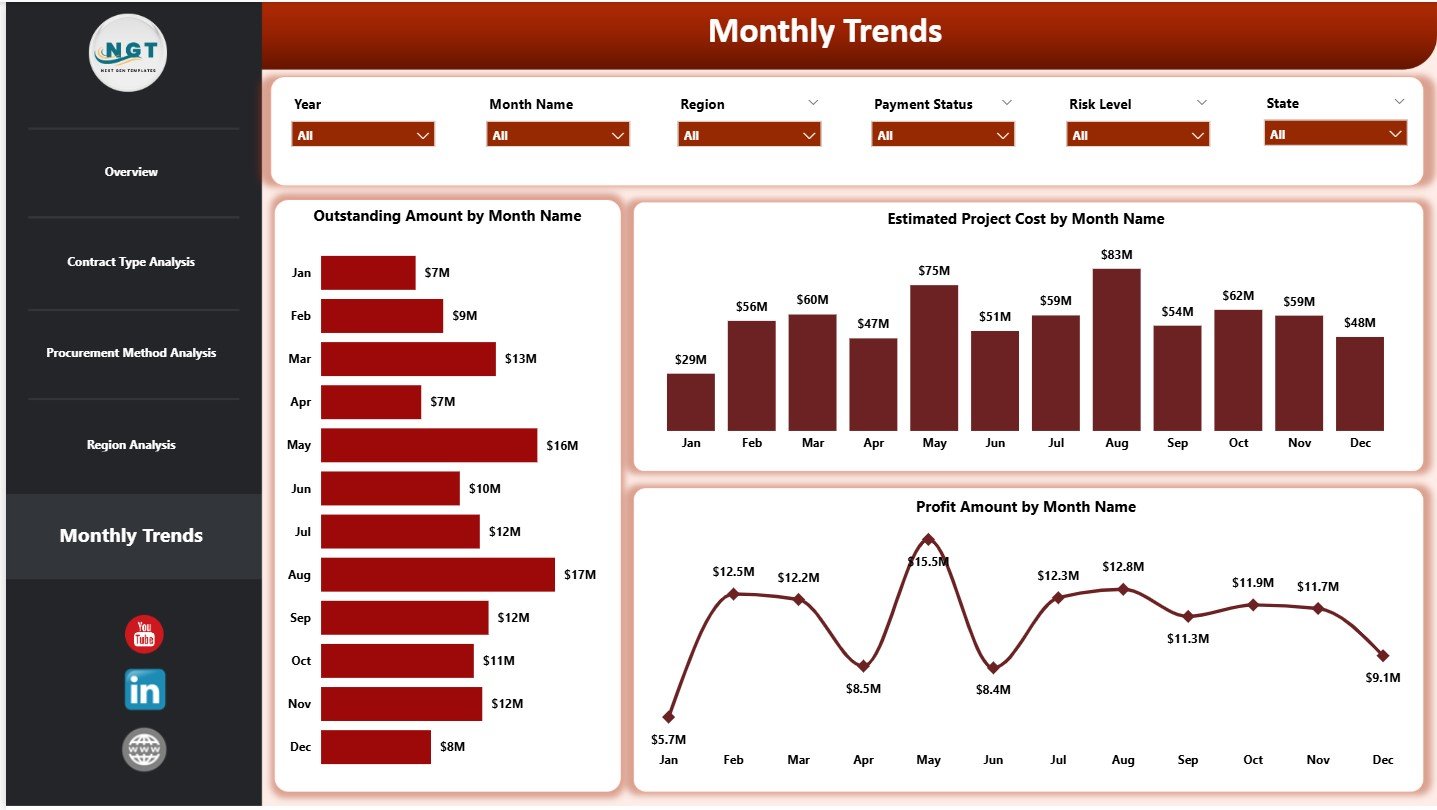
The Monthly Trends Page tracks performance over time. It helps teams understand seasonality, cash flow patterns, and growth trends.
Monthly Trend Charts:
-
Outstanding Amount by Month
-
Estimated Project Cost by Month
-
Profit Amount by Month
Because trends reveal patterns early, organizations can adjust strategies before issues escalate.
Click to Purchases Electricity Contract Management Dashboard in Power BI
Advantages of Electricity Contract Management Dashboard in Power BI
This dashboard delivers strong business value across departments.
Key Advantages:
-
🚀 Centralized contract visibility across all projects
-
📊 Real-time KPI monitoring with interactive slicers
-
💰 Improved cost and profit control
-
⚠️ Early risk identification using compliance and SLA insights
-
🌍 Region-wise performance clarity
-
📅 Time-based trend analysis for better forecasting
Because all insights appear in one place, decision-making becomes faster and more accurate.
Opportunities for Improvement in Electricity Contract Management Dashboards
Even strong dashboards can evolve further.
Key Opportunities:
-
🔄 Integration with ERP and billing systems
-
📈 Predictive analytics for cost overruns
-
📑 Automated compliance scoring
-
🔔 Alerts for SLA breaches and overdue payments
-
📊 Drill-through reports for contract-level analysis
By adding these enhancements, organizations can move from descriptive to predictive analytics.
Best Practices for the Electricity Contract Management Dashboard in Power BI
Following best practices ensures long-term success and adoption.
Best Practices:
✅ Use clean and standardized contract data
✅ Define KPIs clearly with business ownership
✅ Limit visuals to meaningful insights only
✅ Use slicers consistently across all pages
✅ Apply uniform color themes and labels
✅ Validate data regularly with source systems
✅ Train users to interpret KPIs correctly
Because clarity drives adoption, simplicity should guide every design decision.
Who Can Use an Electricity Contract Management Dashboard?
This dashboard supports multiple roles across the organization.
Ideal Users Include:
-
Contract managers
-
Finance and accounting teams
-
Procurement managers
-
Project managers
-
Compliance officers
-
Senior leadership
Since Power BI supports role-based access, each user sees only relevant information.
How Does This Dashboard Improve Business Performance?
This dashboard improves performance by:
-
Reducing manual reporting time
-
Improving cost visibility
-
Increasing profit margin awareness
-
Strengthening compliance monitoring
-
Supporting data-driven contract decisions
As a result, organizations gain better control over high-value electricity contracts.
Conclusion
An Electricity Contract Management Dashboard in Power BI transforms complex contract data into clear, actionable insights. It helps organizations track financial performance, control costs, manage risks, and improve profitability. Moreover, its structured pages, interactive KPIs, and trend analysis empower teams to act faster and smarter.
When organizations adopt this dashboard, they replace guesswork with clarity. As a result, contract management becomes proactive, transparent, and efficient.
Frequently Asked Questions (FAQs)
What is an Electricity Contract Management Dashboard in Power BI?
It is an interactive Power BI report that tracks electricity contract KPIs, costs, revenues, profits, risks, and trends in one place.
Who should use this dashboard?
Contract managers, finance teams, procurement teams, project managers, and leadership teams benefit the most.
Can this dashboard connect to Excel or ERP data?
Yes, Power BI can connect to Excel files, databases, and ERP systems easily.
How often does the dashboard update?
It updates based on the data refresh schedule you configure in Power BI.
Can users filter data by region or contract type?
Yes, slicers allow instant filtering across all pages.
Does this dashboard help in risk management?
Yes, it highlights compliance status, SLA types, and change order risks clearly.
Is Power BI suitable for large contract datasets?
Yes, Power BI handles large datasets efficiently with proper modeling.
Can this dashboard support decision-making?
Absolutely. It provides real-time insights that support faster and better contract decisions.
Click to Purchases Electricity Contract Management Dashboard in Power BI
Visit our YouTube channel to learn step-by-step video tutorials