Managing electricity projects is a complex task. Teams must control budgets, track costs, monitor progress, manage risks, and meet timelines at the same time.Electricity Project Management in Power BI However, when project data remains scattered across multiple files or manual reports, visibility drops. As a result, cost overruns increase, delays appear, and management loses control.
Electricity Project Management in Power BI That is exactly why an Electricity Project Management Dashboard in Power BI becomes an essential solution. It brings all critical project data into one interactive platform. Moreover, it converts raw numbers into meaningful insights that support faster and smarter decisions.
In this detailed article, you will understand what an Electricity Project Management Dashboard in Power BI is, why it is important, how it works, its complete dashboard structure, advantages, opportunities for improvement, best practices, and frequently asked questions. The language remains simple, clear, and practical so you can apply these ideas easily.
Click to Purchases Electricity Project Management in Power BI
What Is Electricity Project Management in Power BI?
Electricity Project Management in Power BI refers to using Power BI dashboards to monitor, analyze, and control electricity-related projects such as power generation, transmission, distribution, and infrastructure upgrades.
Instead of relying on static reports, Power BI provides interactive visuals, KPIs, and slicers. Therefore, project managers and stakeholders can track performance in real time.
This dashboard focuses on:
-
Budget control
-
Cost tracking
-
Forecasting
-
Progress monitoring
-
Regional and departmental performance
Because Power BI updates data dynamically, teams always work with the latest project information.
Why Is Electricity Project Management So Important?
Electricity projects usually involve:
-
High capital investment
-
Long execution timelines
-
Multiple departments and regions
-
Strict regulatory requirements
Even a small delay or cost variance can impact profitability. Therefore, organizations need a centralized project monitoring system.
Key reasons include:
-
To track budget vs actual cost
-
To monitor cost variance early
-
To control budget utilization
-
To forecast project completion cost
-
To analyze regional and departmental performance
Because Power BI supports drill-down analysis, issues surface quickly, and corrective actions happen faster.
Click to Purchases Electricity Project Management in Power BI
How Does an Electricity Project Management Dashboard in Power BI Work?
The dashboard connects to structured project data sources such as Excel sheets, databases, or ERP systems. After that, Power BI processes and visualizes the data.
Typical workflow:
-
Load project data into Power BI
-
Clean and model data using Power Query
-
Create calculated measures for KPIs
-
Design interactive pages and slicers
-
Publish and share dashboards securely
Because Power BI supports scheduled refresh, the dashboard always reflects updated project status.
KPIs help summarize complex project data into actionable metrics.
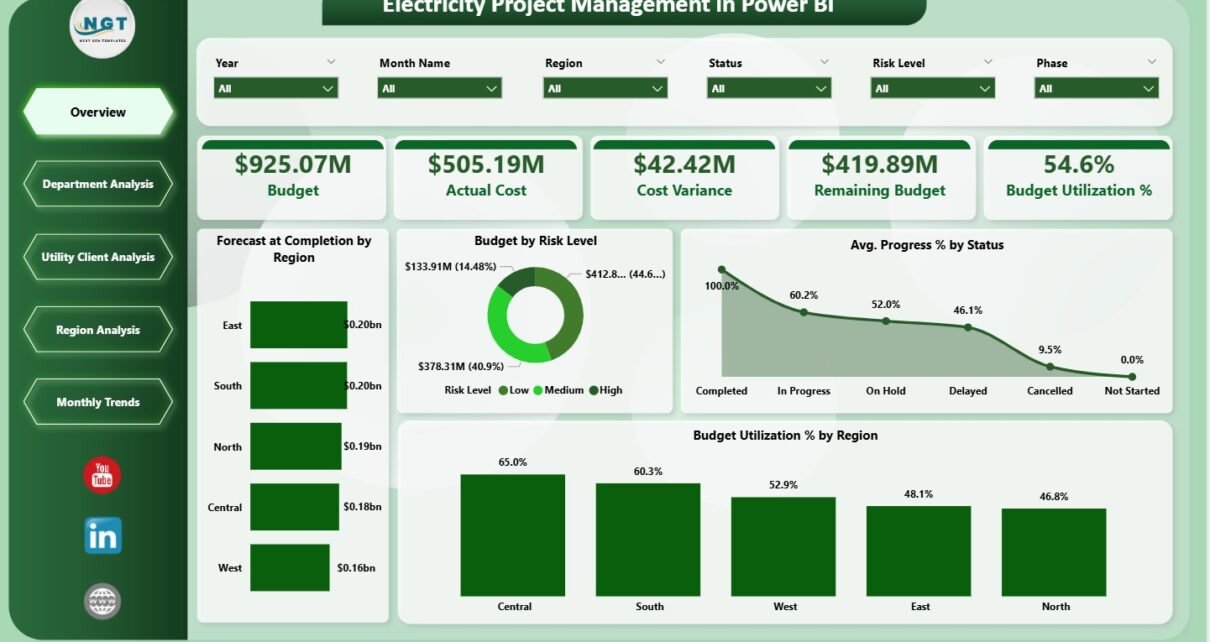
KPI Cards on the Overview Page:
-
Budget – Total approved project budget
-
Actual Cost – Cost incurred till date
-
Cost Variance – Difference between budget and actual cost
-
Remaining Budget – Available funds for completion
-
Budget Utilization % – Percentage of budget consumed
Because these KPIs react to slicers, users can analyze performance by region, department, or client instantly.
What Is the Structure of the Electricity Project Management Dashboard in Power BI?
This dashboard includes five structured pages, each designed for a specific type of analysis. Together, they provide a 360-degree view of project performance.
What Insights Does the Overview Page Provide?
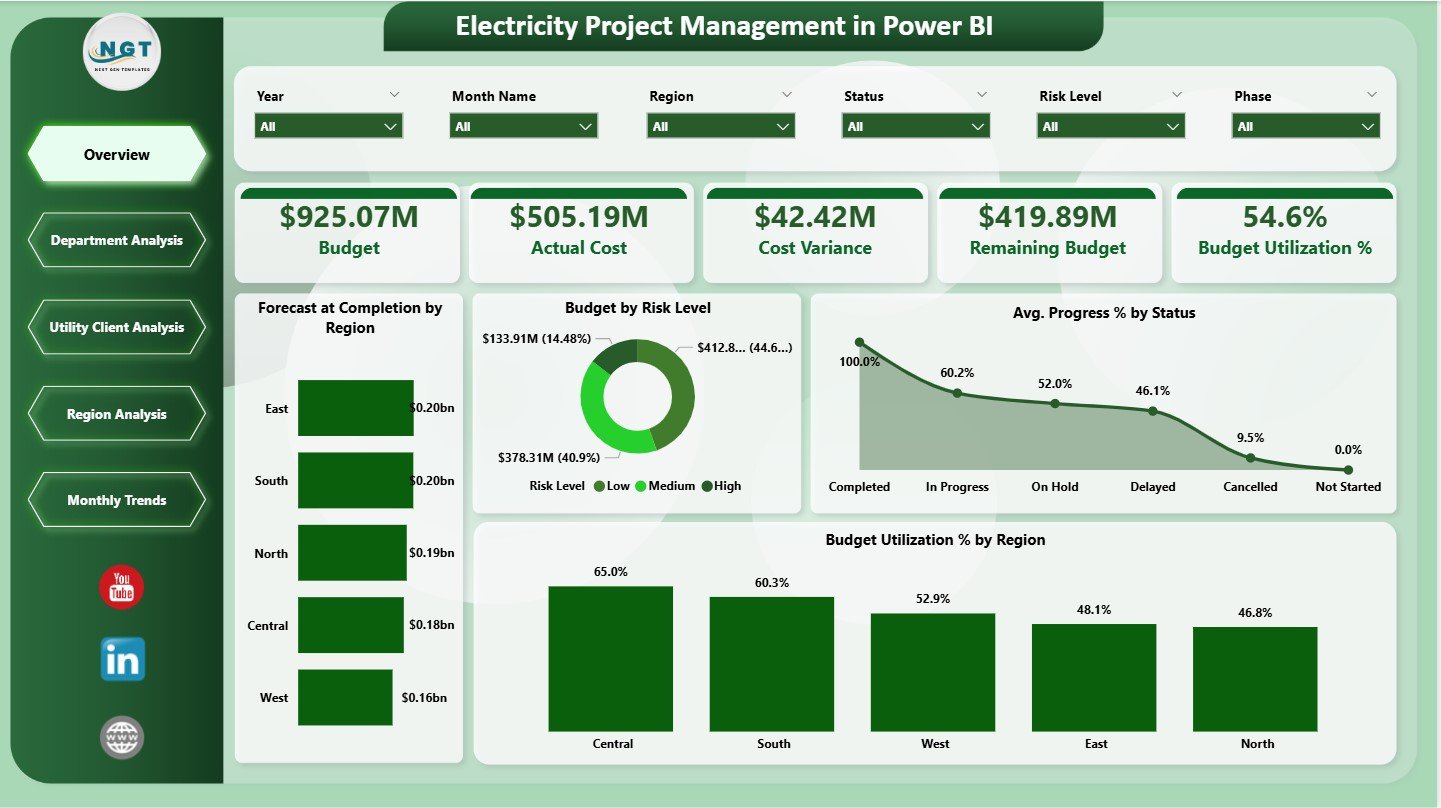
The Overview Page acts as the executive summary of the dashboard. It highlights overall financial health and project progress.
Key Features:
-
Interactive slicers for filtering
-
Five KPI cards for high-level monitoring
-
Four analytical charts for deeper insights
Charts on the Overview Page:
-
Forecast at Completion by Region
Shows expected final cost across regions -
Budget by Risk Level
Highlights budget exposure by risk category -
Average Progress % by Status
Displays project progress by current status -
Budget Utilization % by Region
Compares how efficiently regions use budgets
Because this page summarizes everything, leadership teams often start here.
Click to Purchases Electricity Project Management in Power BI
How Does Department Analysis Improve Cost Control?
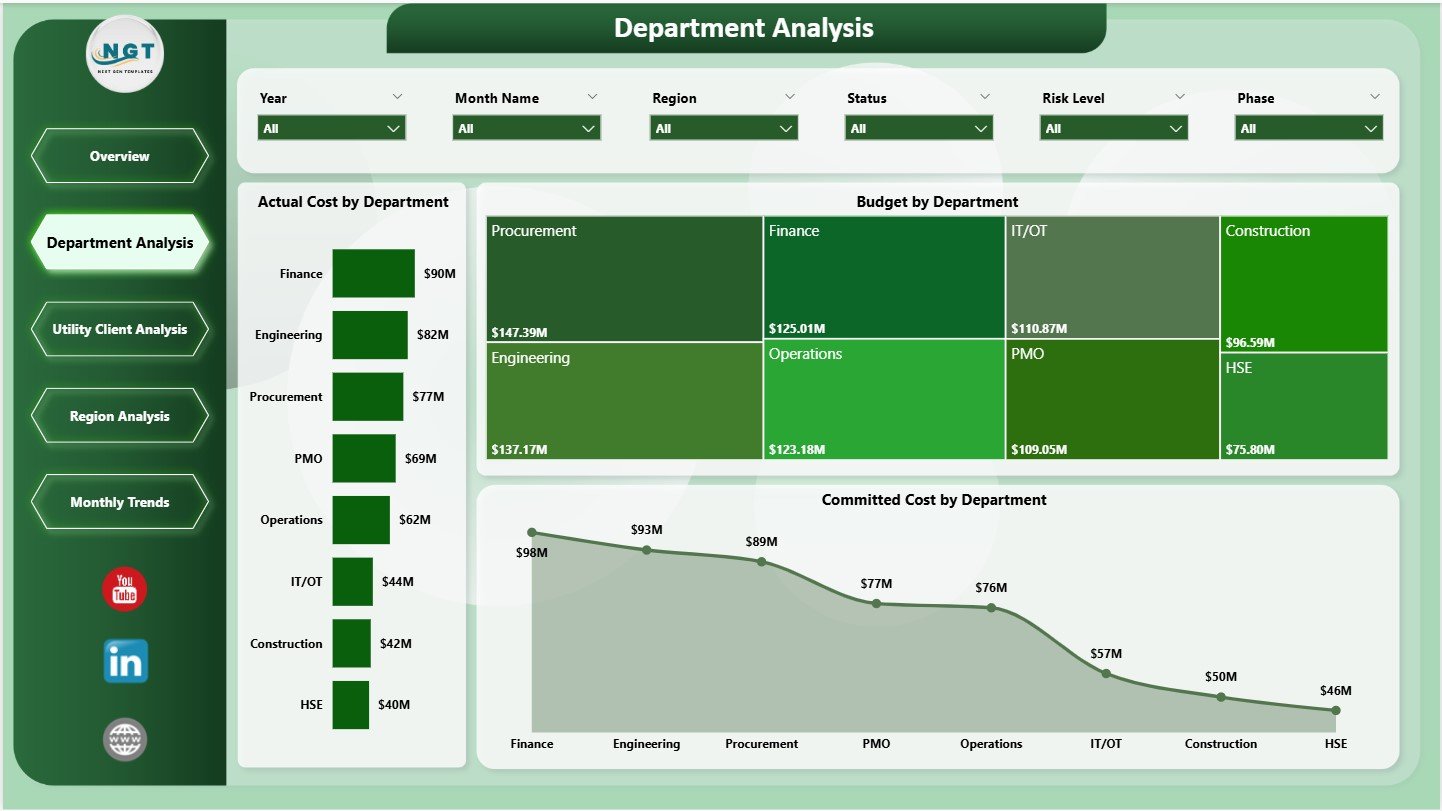
The Department Analysis Page focuses on cost performance across internal departments.
Key Charts:
-
Actual Cost by Department
Identifies departments with higher spending -
Budget by Department
Shows budget allocation across teams -
Committed Cost by Department
Highlights future financial commitments
Because departments operate differently, this page helps management control spending and allocate resources effectively.
Click to Purchases Electricity Project Management in Power BI
Why Is Utility Client Analysis Critical?
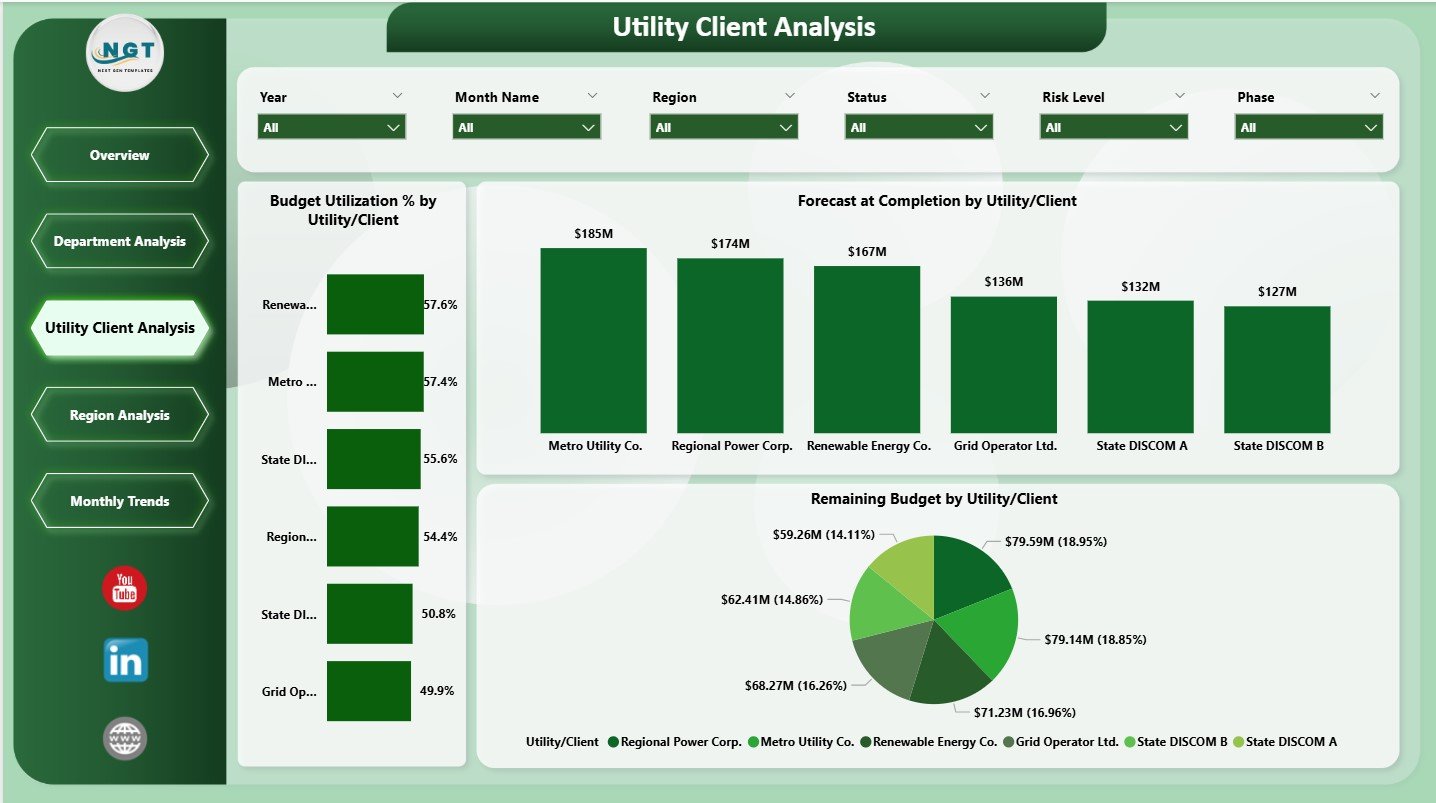
Electricity projects often involve multiple utility clients. However, not all clients deliver equal returns.
Utility Client Analysis Page Includes:
-
Budget Utilization % by Utility / Client
-
Forecast at Completion by Utility / Client
-
Remaining Budget by Utility / Client
Because this analysis compares client-wise performance, organizations can prioritize profitable clients and manage risks better.
How Does Region Analysis Support Better Planning?
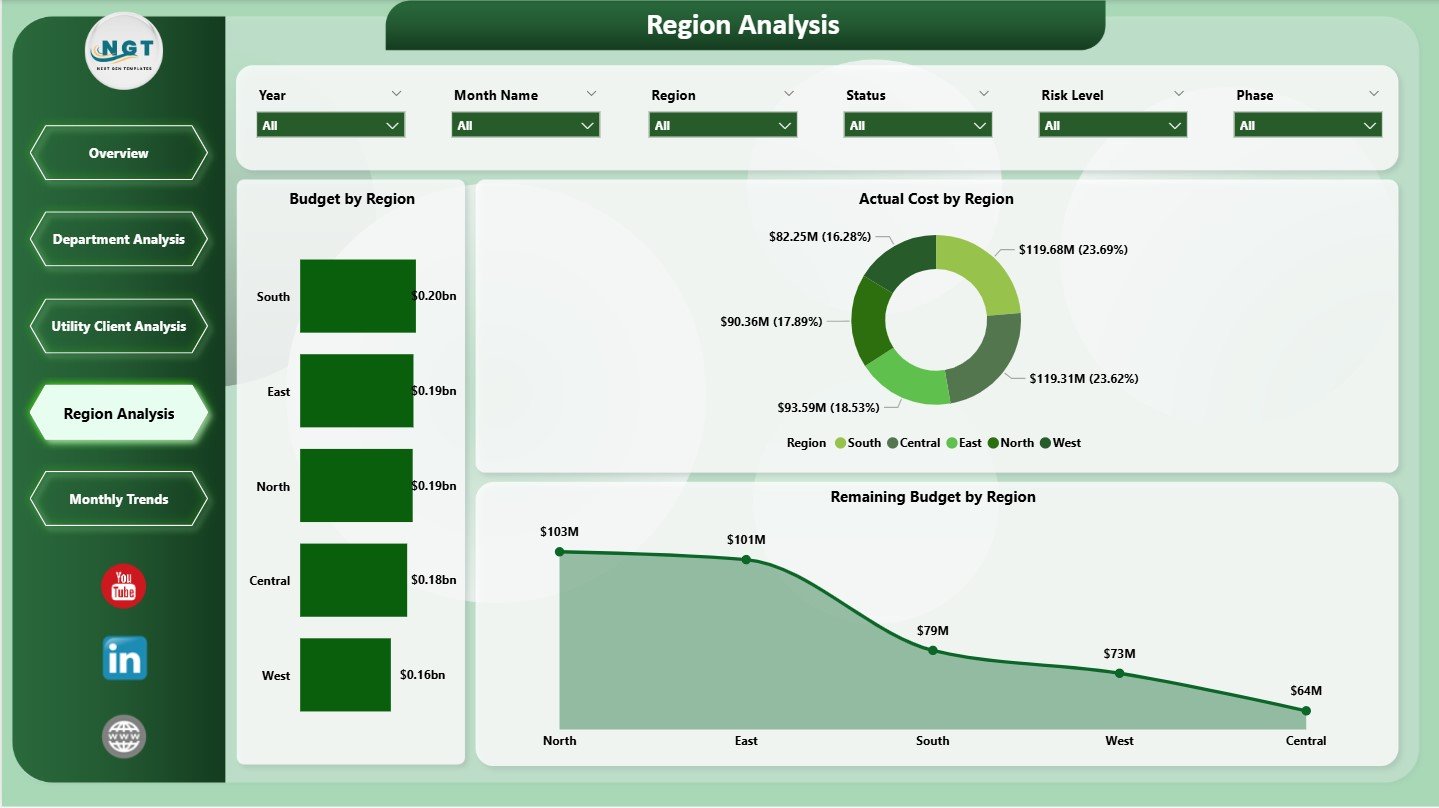
Electricity projects spread across regions due to infrastructure and regulatory needs. However, regional performance often varies.
Region Analysis Charts:
-
Budget by Region
-
Actual Cost by Region
-
Remaining Budget by Region
Because this page highlights regional differences, leadership teams can redirect budgets and manpower strategically.
Click to Purchases Electricity Project Management in Power BI
What Trends Does the Monthly Trends Page Reveal?
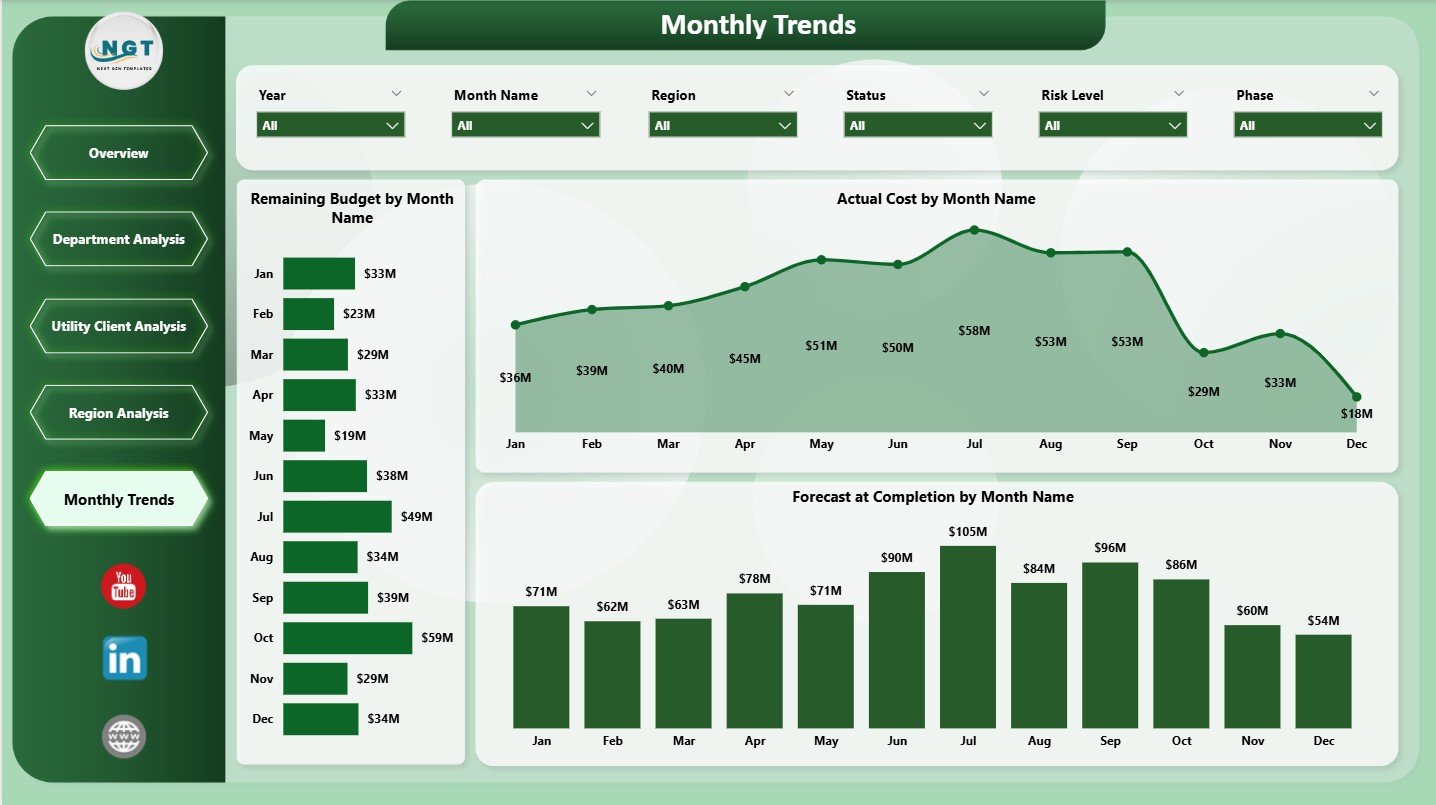
The Monthly Trends Page focuses on time-based performance. It helps teams identify cost patterns and forecast future outcomes.
Monthly Trend Charts:
-
Remaining Budget by Month
-
Actual Cost by Month
-
Forecast at Completion by Month
Because trends reveal early warning signs, teams can adjust execution plans proactively.
Advantages of Electricity Project Management in Power BI
This dashboard delivers measurable value across the organization.
Key Advantages:
-
⚡ Centralized project visibility
-
📊 Real-time budget and cost tracking
-
💰 Improved budget utilization control
-
🔍 Early identification of cost overruns
-
🌍 Region and department-wise insights
-
📅 Clear monthly trend analysis
Because all insights appear in one place, decision-making becomes faster and more accurate.
Opportunities for Improvement in Electricity Project Management Dashboards
Even effective dashboards can evolve further.
Key Opportunities:
-
📈 Predictive forecasting using historical data
-
🔄 Integration with ERP and scheduling tools
-
🚨 Automated alerts for budget overruns
-
🧠 AI-based risk scoring
-
📑 Drill-through views for project-level details
By adding these features, organizations can move from monitoring to forecasting and optimization.
Click to Purchases Electricity Project Management in Power BI
Best Practices for the Electricity Project Management in Power BI
Following best practices ensures long-term dashboard success and adoption.
Best Practices:
-
✅ Maintain clean and validated project data
-
✅ Define KPIs clearly before building visuals
-
✅ Keep dashboards simple and focused
-
✅ Use consistent slicers across pages
-
✅ Apply uniform colors and labels
-
✅ Refresh data regularly
-
✅ Train users on KPI interpretation
Because clarity drives usage, simplicity should guide every design choice.
Who Should Use an Electricity Project Management Dashboard?
This dashboard supports multiple roles.
Ideal Users Include:
-
Project managers
-
Finance teams
-
Engineering managers
-
Utility management teams
-
Regional heads
-
Senior leadership
Since Power BI supports role-level security, each user sees only relevant insights.
Click to Purchases Electricity Project Management in Power BI
How Does This Dashboard Improve Project Performance?
This dashboard improves performance by:
-
Reducing manual reporting effort
-
Improving cost transparency
-
Supporting proactive risk management
-
Enhancing budget forecasting accuracy
-
Strengthening data-driven decision-making
As a result, electricity projects finish closer to budget and schedule targets.
Conclusion
An Electricity Project Management Dashboard in Power BI transforms complex project data into clear and actionable insights. It helps organizations control budgets, monitor costs, forecast completion, and analyze performance across departments, regions, and clients. Moreover, its interactive structure empowers teams to act quickly and confidently.
When organizations adopt this dashboard, they replace manual reporting with real-time intelligence. As a result, project management becomes proactive, transparent, and efficient.
Frequently Asked Questions (FAQs)
What is Electricity Project Management in Power BI?
It is the use of Power BI dashboards to monitor budgets, costs, progress, and forecasts for electricity projects.
Who should use this dashboard?
Project managers, finance teams, engineers, and leadership teams benefit the most.
Can this dashboard connect to Excel data?
Yes, Power BI connects easily to Excel, databases, and ERP systems.
How often does the data refresh?
Data refresh depends on the configured Power BI schedule.
Can users filter data by region or department?
Yes, slicers allow instant filtering across all pages.
Does this dashboard help reduce cost overruns?
Yes, it highlights cost variance and forecast risks early.
Is Power BI suitable for large electricity projects?
Yes, Power BI handles large datasets efficiently with proper modeling.
Can this dashboard support strategic planning?
Absolutely. It provides insights that support budgeting, forecasting, and resource planning.
Click to Purchases Electricity Project Management in Power BI
Visit our YouTube channel to learn step-by-step video tutorials