Home>Blogs>Charts and Visualization>Excel Magic: Stunning Animated Progress Circle Charts for Project Tracking>Project Completion Chart with Animated Progress Circle-2
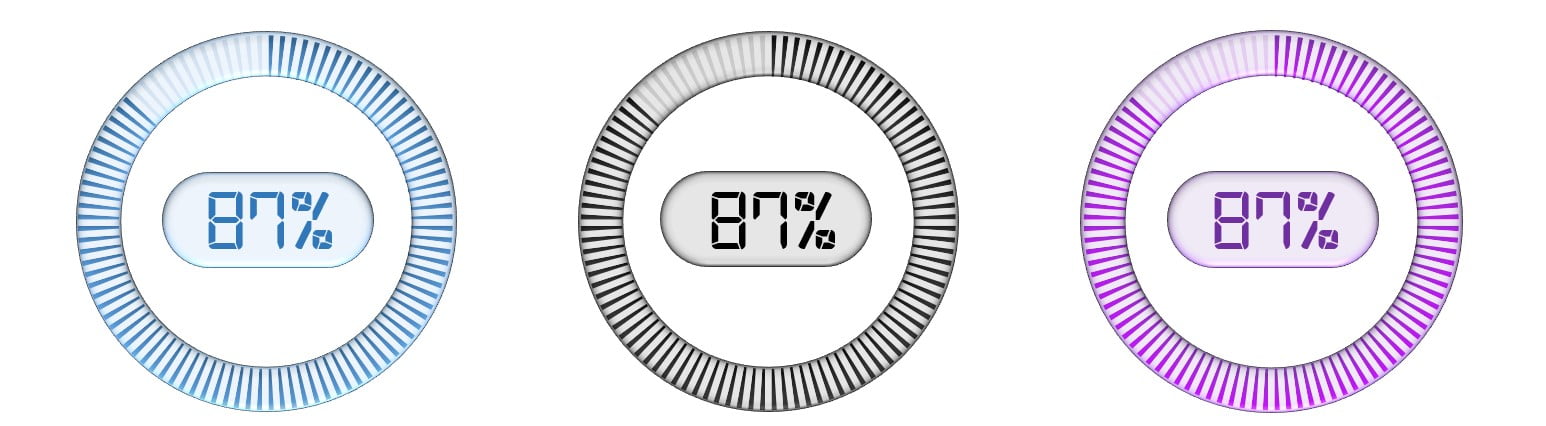
Project Completion Chart with Animated Progress Circle-2
Related Articles
Transforming Data into Decisions