Personal trainers and boutique fitness studios lose an estimated 4-7 hours every week compiling trainer performance, client rating, and revenue reports by hand — time that could fund 2-3 extra paid sessions. The Fitness Trainer Dashboard in Excel compresses that weekly reporting job into under 10 minutes by giving you 6 core KPIs, 15 pivot-driven charts, and 5 dedicated analysis pages that refresh automatically the moment you update your session log.
If you run a personal training business, a 2-15 trainer studio, or manage online coaching clients across multiple locations, you already know the pain: Mindbody and ABC Fitness give you booking, but their reporting dashboards cost $139-499 per month and still make you export to Excel to actually analyze anything. This article walks through every sheet of the Fitness Trainer Dashboard in Excel and shows how a one-time $17.99 template replaces the analytics layer of those enterprise platforms.
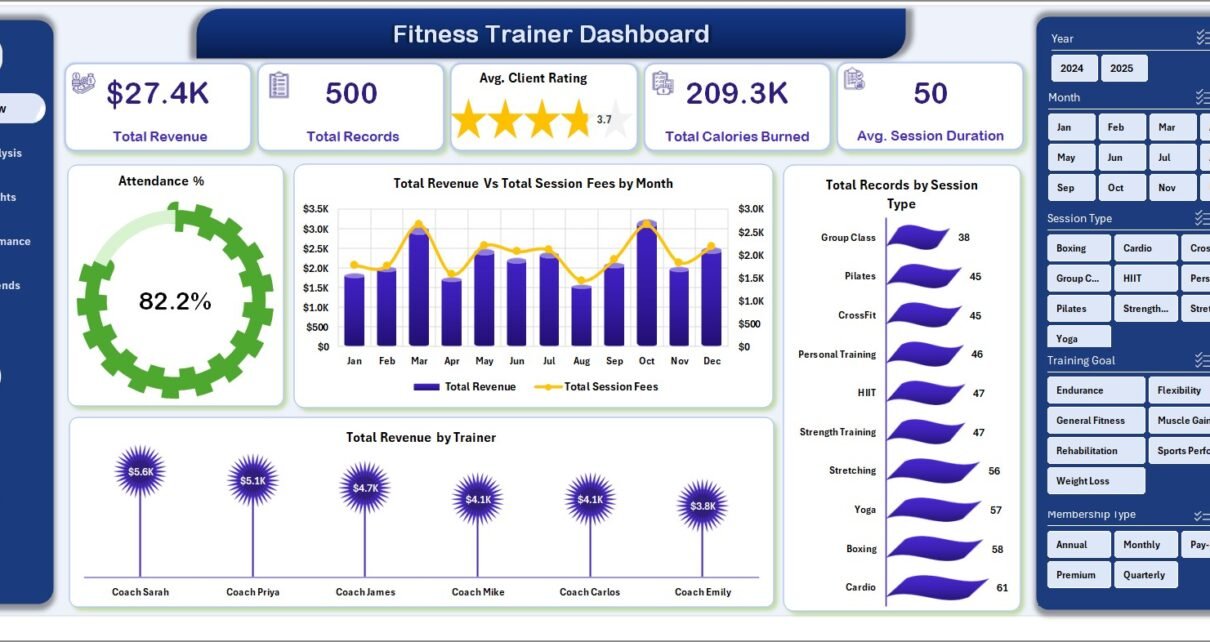
Fitness Trainer Dashboard in Excel
Key Features of the Fitness Trainer Dashboard in Excel
The Fitness Trainer Dashboard in Excel is a 100% pivot-table and slicer-powered workbook — no macros, no VBA, no add-ins — that runs on Excel for Windows, Mac, and Excel Online. Here’s what makes it different from a generic “personal trainer spreadsheet” template:
- 6 high-level KPI cards on the Overview page: Total Revenue, Total Records, Average Client Rating, Total Calories Burned, Average Session Duration, and Attendance %.
- 5 dedicated analysis pages — Overview, Session Analysis, Client Insights, Trainer Performance, and Revenue Trends — each with 3-4 pivot charts tuned for specific business decisions.
- Hidden Support Sheet that houses every pivot source. Update the Data sheet, hit Data → Refresh All, and every KPI, chart, and slicer on all 5 analysis pages updates automatically.
- Interactive slicers let you filter by trainer, session type, location, membership type, and time slot without writing a single formula.
- 14-column structured Data sheet with clear labels — date, trainer, client, session type, duration, calories, fee, rating, attendance, location, equipment, referral source, training goal, membership type.
- Built with standard Excel pivots so every chart is fully customizable using the ribbon you already know.
Dashboard Pages Explanation
1. Overview Page
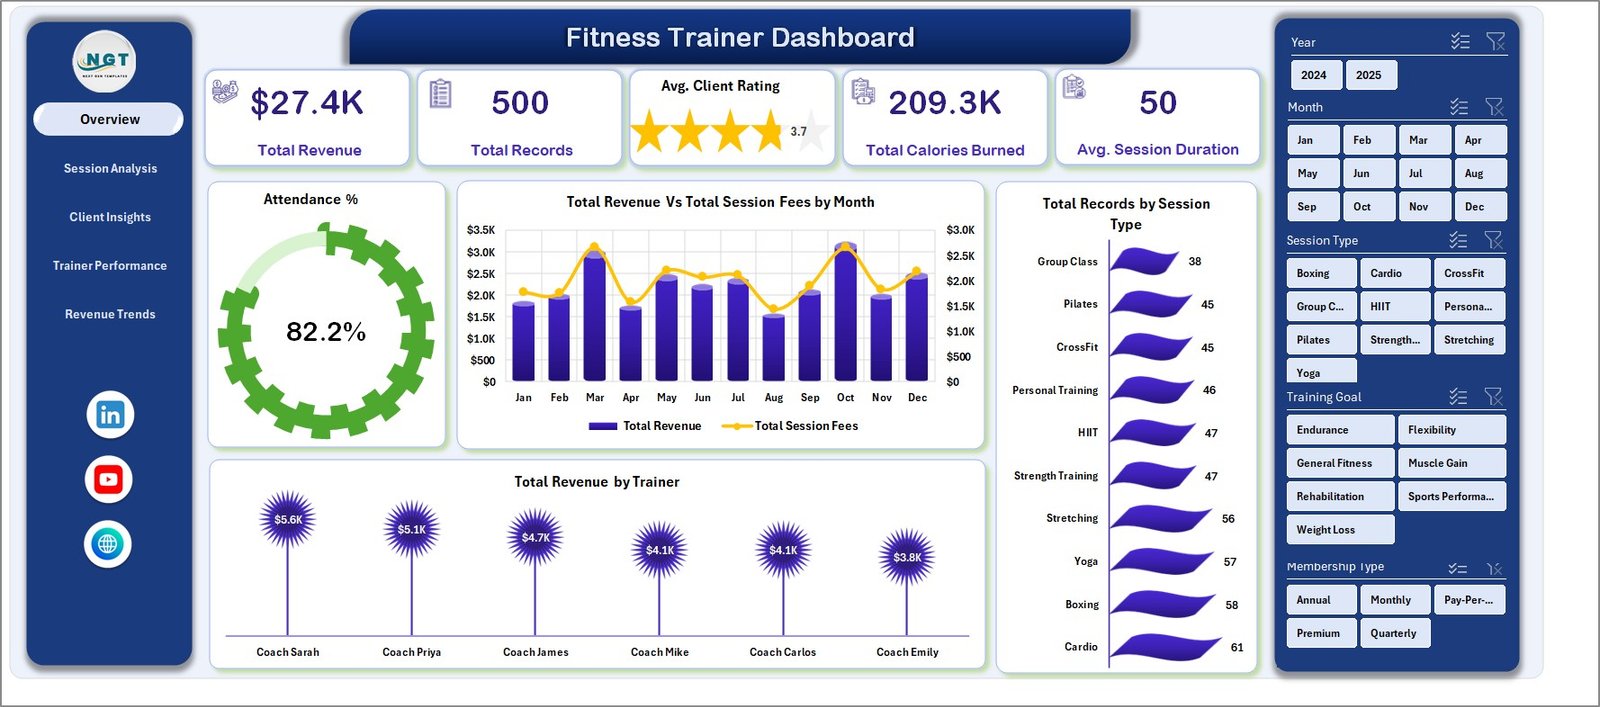
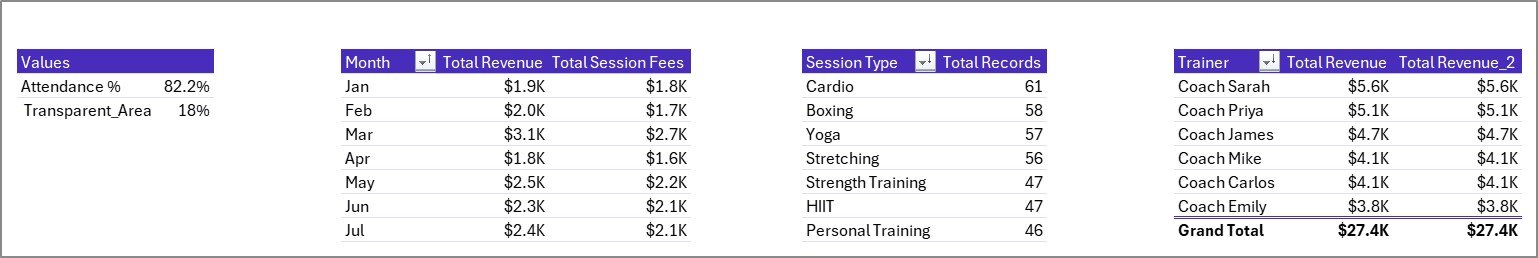
The Overview tab is your weekly-scan landing page. The top row shows 6 KPI cards — Total Revenue, Total Records, Avg. Client Rating, Total Calories Burned, Avg. Session Duration, and Attendance %. Below them, three analytical charts: Total Revenue Vs Total Session Fees by Month (compares monthly collections against billed fees to highlight collection gaps), Total Records by Session Type (ranks which session formats dominate your booking volume), and Total Revenue by Trainer (who’s actually bringing in the money). Multi-category slicers let you filter the entire page in one click.
Overview Page
2. Session Analysis
The Session Analysis tab zooms into operational metrics. Four charts: Total Records by Time Slot (finds peak booking hours — do you need more morning trainers?), Total Calories Burned by Session Type (shows which formats drive the most training intensity), Total Revenue by Equipment Used (tells you which equipment categories generate the most billable work), and Total Revenue by Session Type (ranks session categories by revenue share). Use this page to decide which session formats to push harder.
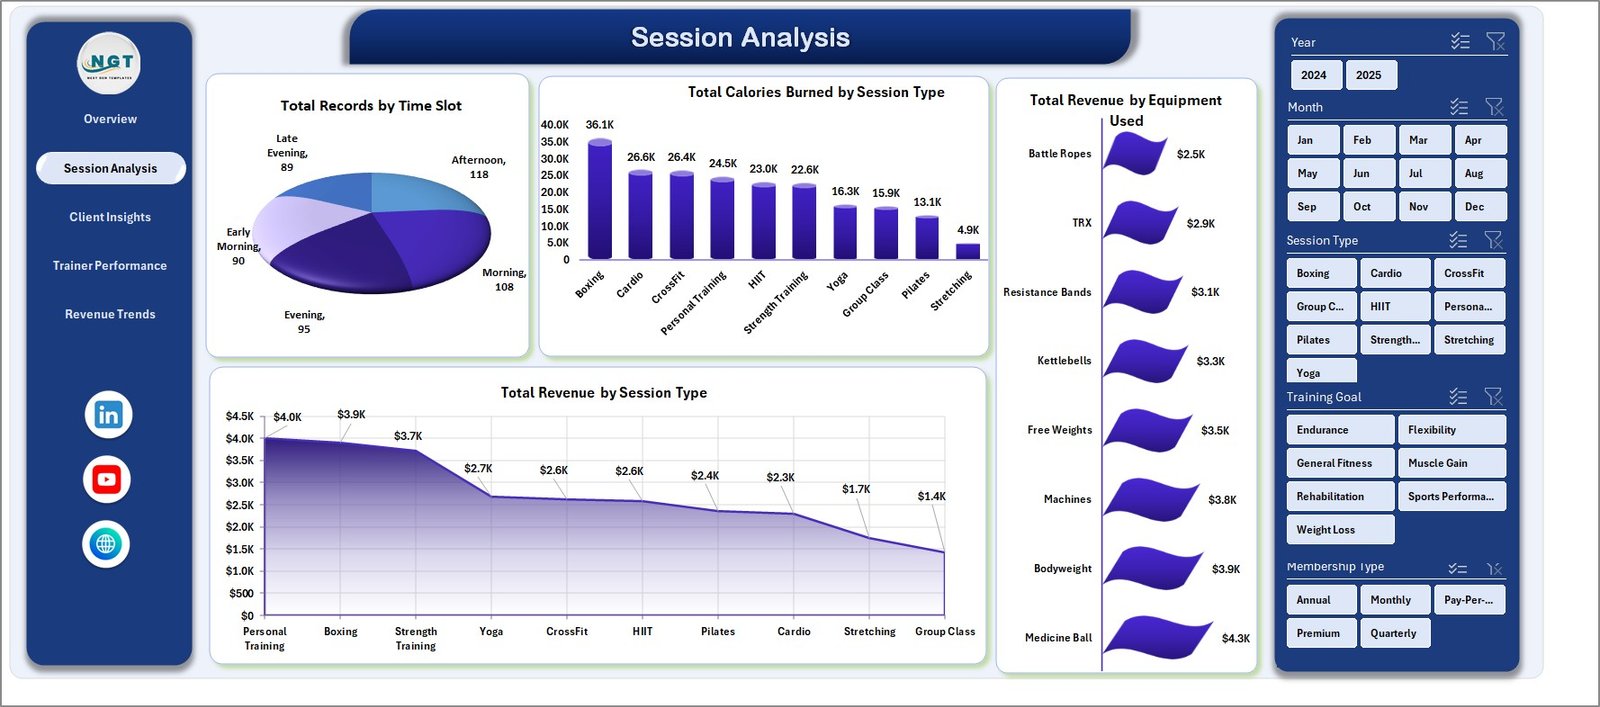
Session Analysis
3. Client Insights
The Client Insights tab answers the question every fitness business owner should ask monthly: who are my best clients and where are they coming from? Four charts: Total Records by Gender, Total Revenue by Age Group (finds your highest-LTV demographic), Total Records by Referral Source (tells you which marketing channel actually converts — Instagram, word-of-mouth, gym partnerships, Google Ads), and Total Revenue by Membership Type (compares revenue across monthly, quarterly, and annual plans).
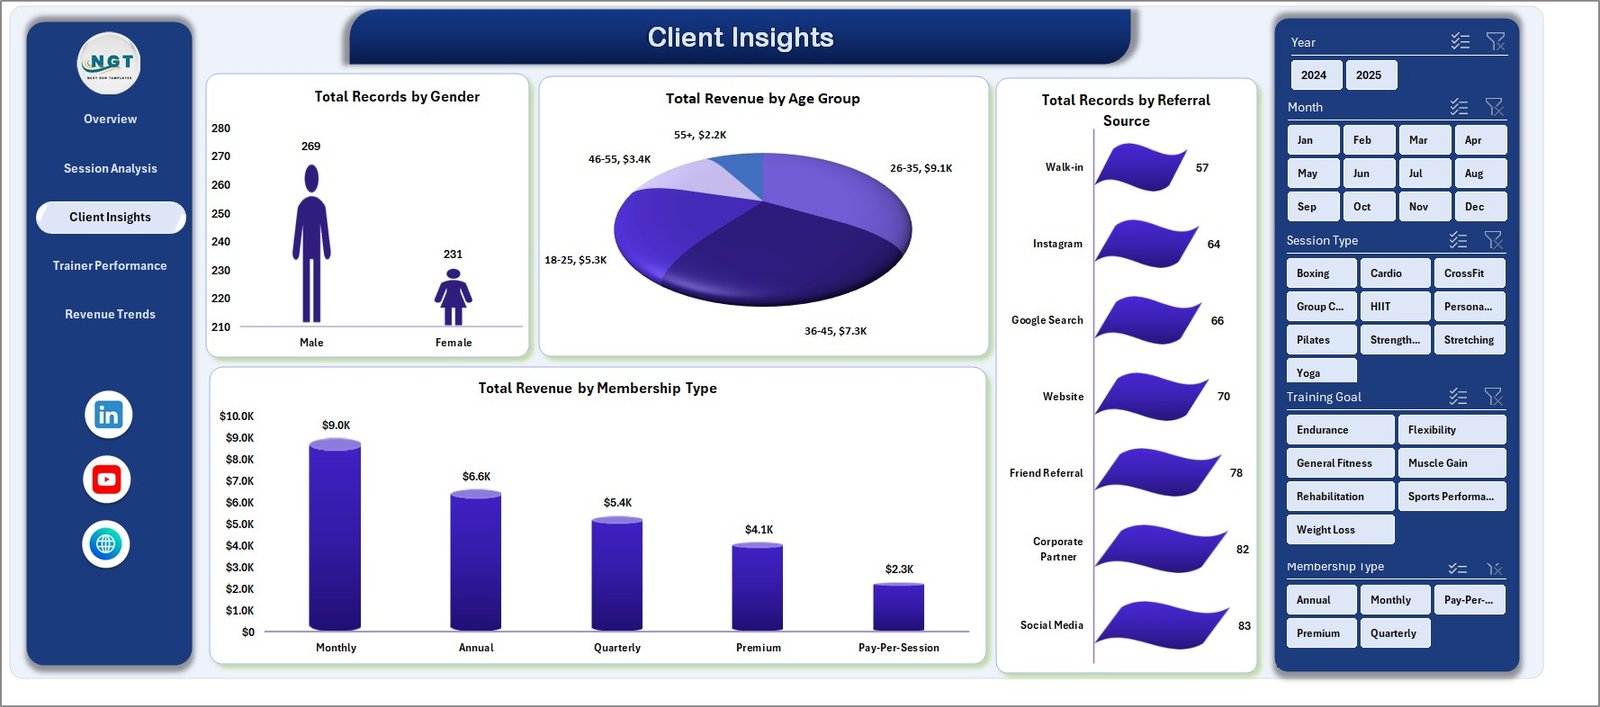
Client Insights
4. Trainer Performance
Trainer Performance is the tab you pull up during quarterly reviews and commission conversations. Four charts side by side: Total Records by Trainer, Avg. Client Rating by Trainer, Total Calories Burned by Trainer, and Total Revenue by Location (compares gym-floor, home-visit, and online performance). Apply the Trainer slicer and the entire dashboard zooms into one trainer’s full scorecard.
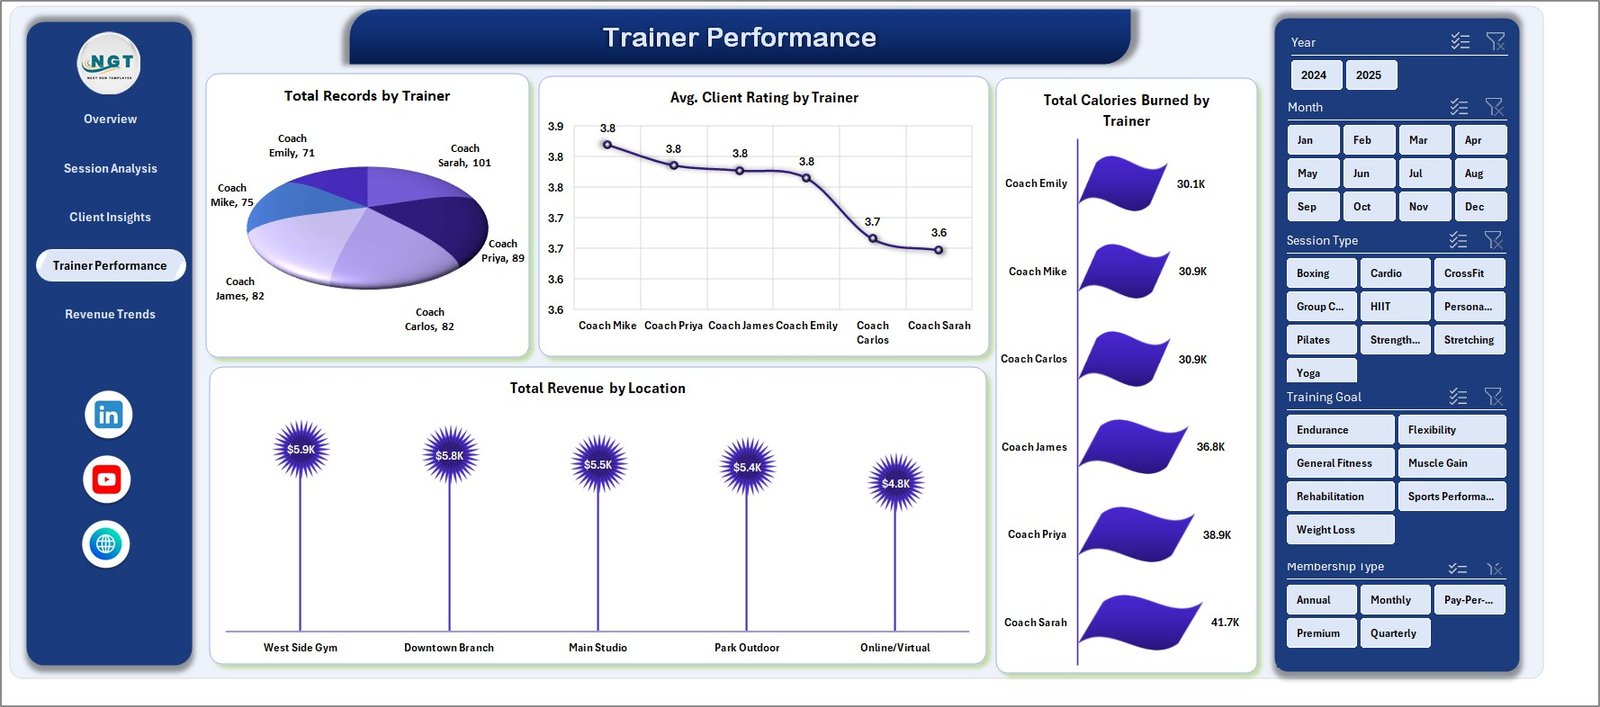
Trainer Performance
5. Revenue Trends
The Revenue Trends page is your long-horizon financial view. Four charts: Total Revenue Vs Total Supplements by Year (tracks how your supplement-referral income scales alongside training revenue), Total Records by Month (exposes seasonality so you know when to push promotions), Total Records by Attendance Status (what’s your no-show and cancellation rate?), and Total Revenue by Training Goal (weight-loss vs muscle-gain vs endurance vs rehab — where’s the money actually coming from?).
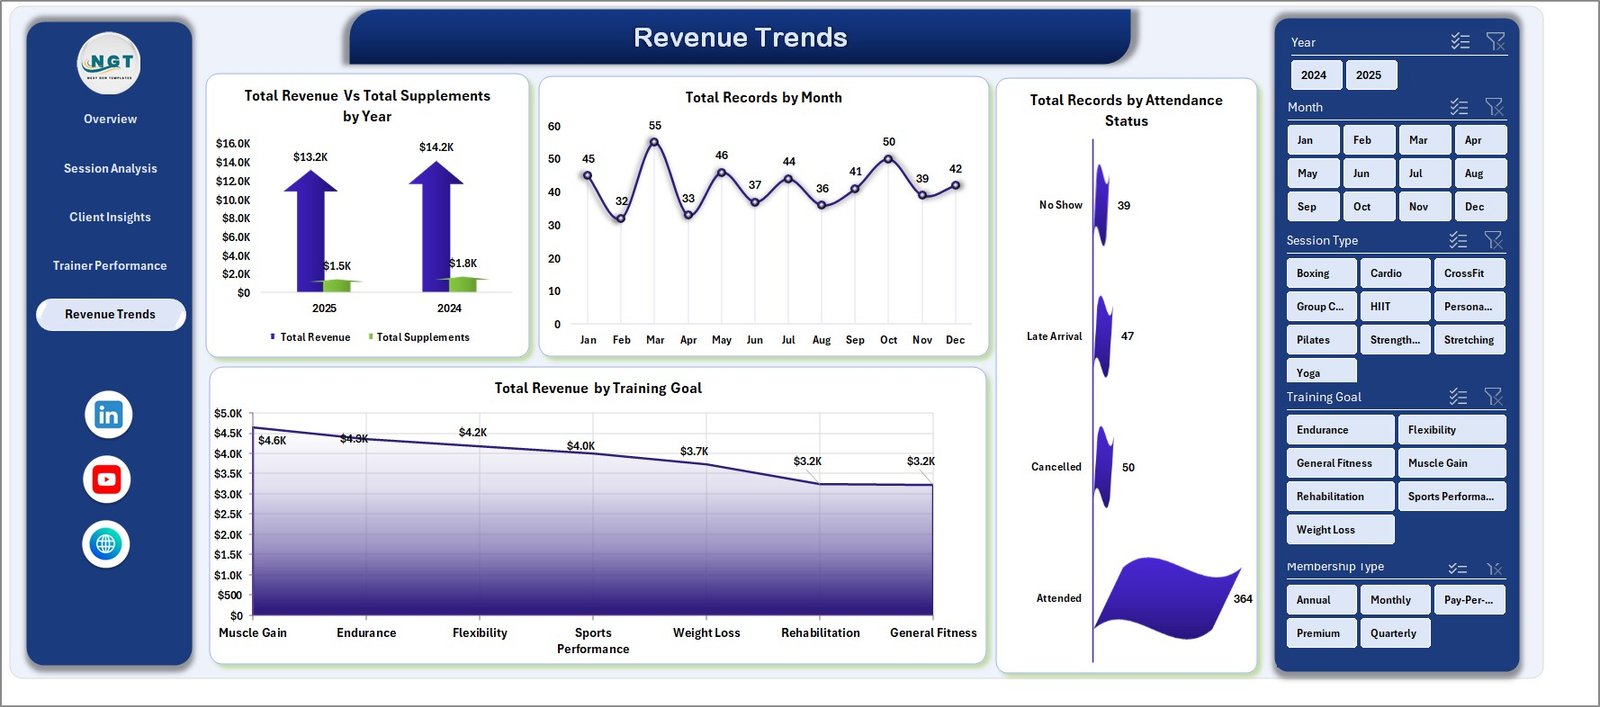
Revenue Trends
6. Data Sheet
The Data sheet is your single source of truth. Add one row per session with Date, Trainer, Client, Session Type, Duration, Calories, Fee, Rating, Attendance, Location, Equipment, Referral Source, Training Goal, and Membership Type. Keep the column structure intact, hit Data → Refresh All, and the 5 analysis pages update automatically. You can export this sheet from your booking platform or enter sessions manually.
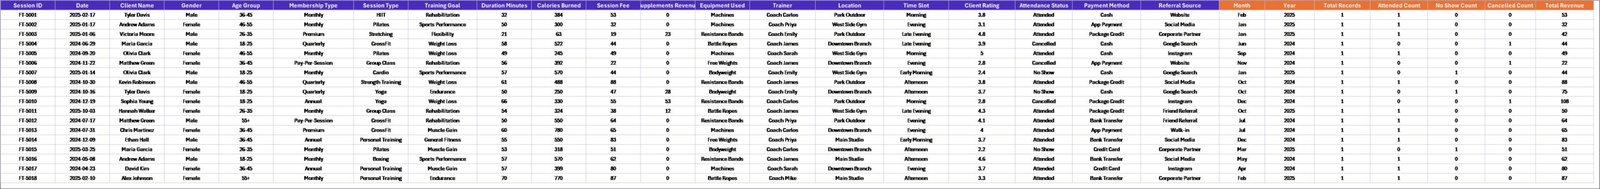
Data Sheet tab
7. Support Sheet
The Support sheet is the engine room — it holds every pivot table that drives every KPI card, chart, and slicer on all 5 analysis pages. You never edit it directly; you just hit Data → Refresh All after updating the Data sheet. Right-click the tab and select Hide for a cleaner workbook when sharing with stakeholders.
Support sheet tab
Fitness Trainer Dashboard in Excel vs. Google Sheets Equivalent vs. Mindbody / ABC Fitness — Feature Comparison
| Feature | Fitness Trainer Dashboard (Excel) | Google Sheets Equivalent | Mindbody / ABC Fitness |
|---|---|---|---|
| Cost | $17.99 one-time | $9-15 one-time | $139-499 / month |
| Platform | Microsoft Excel (offline) | Google Sheets (cloud only) | Web + mobile app |
| Setup time | Under 10 minutes | Under 10 minutes | 2-6 weeks onboarding |
| Pivot-powered auto-refresh | Native Excel pivots | Limited pivot refresh | Proprietary engine |
| Offline access | Yes | Requires internet | Cloud-dependent |
| Customizable charts | Full control via ribbon | Full control | Locked layouts |
| Per-user fees | None | None | $10-30 per trainer / month |
| Year-1 cost at 3 trainers | $17.99 total | $9-15 total | $1,668-5,988 |
| Ownership | Yours forever | Yours forever | SaaS license |
For fitness trainers and studio owners who want serious reporting without paying enterprise SaaS fees, the Fitness Trainer Dashboard in Excel sits in the sweet spot.
Who Should Use This Template
Perfect for:
- Independent personal trainers tracking 10-500 sessions per month
- Boutique gyms and fitness studios with 2-15 trainers on the floor
- Online fitness coaches running virtual sessions and needing location-split reporting
- Studio managers running monthly trainer reviews who want rating-and-revenue data in one view
- Fitness business owners who already have booking software but want real analytics on top of it
Not a fit if:
- You run a multi-location gym chain needing centralized cloud POS, door access control, and integrated billing
- You need mobile booking for clients or automated payment processing — use Mindbody or ABC Fitness for those
- You’re on Excel 2013 or older (pivot-slicer functionality requires Excel 2016 or later)
Real-World Use Cases
Marco runs a 4-trainer boutique CrossFit studio in Austin. Every Monday he opens the Fitness Trainer Dashboard, filters the Overview page by “last week” using the date slicer, and spends exactly 10 minutes reviewing trainer revenue, client ratings, and attendance — data he previously spent 90 minutes compiling from Mindbody exports. He uses the Trainer Performance tab during monthly 1:1s with each coach.
Priya is a solo personal trainer with 35 active clients split between home visits and online sessions. She uses the Revenue Trends page to see how her supplement-referral income is growing against her session revenue, and the Client Insights page to figure out which referral channel (Instagram vs word-of-mouth vs gym partnerships) is actually converting to long-term clients. Based on that data, she doubled down on Instagram Reels and dropped her Google Ads spend by 60% last quarter.
The Patel family runs a 12-trainer urban fitness chain with 3 locations. They review the Trainer Performance tab during quarterly reviews to compare trainer ratings and revenue across locations, and use the Location breakdown on the Trainer Performance page to spot which studio needs more weekend staffing — without paying $499/month per location for an enterprise analytics add-on.
Advantages of the Fitness Trainer Dashboard in Excel
The biggest advantage is speed to value. You download, unzip, open in Excel, paste your session data, and have a working dashboard in under 10 minutes. No onboarding calls, no SaaS account creation, no credit-card-for-trial setup. Second, the cost structure is flat — one payment of $17.99 replaces a recurring $139-499/month reporting bill, which adds up to $1,668-5,988 in year one alone. Third, you own your data and your template forever — no vendor lock-in, no data held hostage if you cancel. Fourth, because it’s built entirely on Microsoft Excel pivot tables (see the official PivotTable documentation on Microsoft Support), you can fully customize every chart, add new metrics, and extend the template using skills you already have.
Opportunities for Improvement
To be honest about the limitations: the Fitness Trainer Dashboard is a reporting layer, not a booking-and-billing platform. It doesn’t let clients book sessions, doesn’t process payments, and doesn’t send automated reminders. If you need those features, you’ll still need Mindbody, ABC Fitness, or a similar platform — but you can run this dashboard on top of the data exports from those tools. Additionally, the template requires Excel 2016 or later for slicers, and on Excel for Mac some slicer-formatting options render slightly differently than on Windows (functionality is identical). Finally, because the data lives locally, there’s no built-in real-time multi-user collaboration — for that, consider the Google Sheets version.
Best Practices
- Refresh daily, not weekly. Build the habit of updating the Data sheet at end-of-day and hitting Refresh All — the weekly report then takes 2 minutes instead of 2 hours.
- Export from your booking platform. Most platforms (Mindbody, Trainerize, TrueCoach) let you export session CSVs. Map the columns once, then reuse the mapping.
- Hide the Support sheet before sharing the file with trainers or stakeholders — keeps the view clean.
- Use slicer combinations for trainer reviews. Filter by trainer + date range to get a single trainer’s scorecard for the review period.
- Back up your Data sheet monthly. Keep a separate file with “raw data” so you always have history to fall back to.
Explore Relevant Templates
- Gym Fitness Business Dashboard in Excel — studio-level view with membership, revenue, and class-mix analytics.
- CrossFit Gym KPI Scorecard in Excel — scorecard-style monthly performance tracker.
- Fitness Industry KPI Scorecard in Google Sheets — cloud-first alternative for collaborative teams.
- Read the Gym Fitness Business Dashboard walkthrough for a broader studio-level reporting view.
- Read the CrossFit Gym KPI Scorecard article for a month-by-month scorecard approach.
Also available as: Gym Fitness Business Dashboard in Power BI | Gym Fitness Business Dashboard in Google Sheets | Gym Fitness Business Dashboard in HTML
Frequently Asked Questions
What KPIs does the Fitness Trainer Dashboard track?
The Fitness Trainer Dashboard in Excel tracks 6 primary KPIs — Total Revenue, Total Records, Average Client Rating, Total Calories Burned, Average Session Duration, and Attendance % — plus 15 chart-level breakdowns across session type, trainer, location, equipment, age group, gender, referral source, membership type, and training goal.
Does this Excel template require macros or VBA?
No. The Fitness Trainer Dashboard is 100% formula and pivot-table driven. It does not use macros or VBA, so it runs on Excel for Windows, Excel for Mac, and Excel Online with full functionality. No security warnings, no macro permissions, no compatibility hassles.
How does this compare to Mindbody or ABC Fitness?
Mindbody and ABC Fitness are full booking-and-billing platforms priced at $139-499 per month. The Fitness Trainer Dashboard in Excel is a one-time $17.99 reporting template — it replaces the analytics dashboards inside those tools without replacing the booking layer. Many studios use both together.
How long does setup take?
Under 10 minutes. Open the file, paste your session records into the Data sheet, hit Data → Refresh All on the Excel ribbon, and the entire Fitness Trainer Dashboard populates. No onboarding calls, no account creation, no training videos required to get started.
Can I customize the charts and KPI cards?
Yes. Every chart in the Fitness Trainer Dashboard is a standard Excel pivot chart, so you can add or remove fields, change chart types, adjust colors, and extend the template using the normal Excel ribbon. The Support sheet exposes every pivot source for advanced customization.
Will my client data stay private?
Yes. The Fitness Trainer Dashboard runs 100% locally in your copy of Excel. No data is uploaded to any server, no login is required, and no cloud sync happens unless you choose to save the file to OneDrive or SharePoint yourself. Your client records never leave your device.
Do I get lifetime updates?
You get the current version of the Fitness Trainer Dashboard forever with no renewals, no subscription, and no expiry. If we release a major version update, you’ll get it free as an existing customer.
About the Author
Built by PK — Microsoft Certified Professional with 15+ years of Excel, Google Sheets, and Power BI experience. Founder of NextGenTemplates, reaching 300K+ subscribers across YouTube channels. Every template is hand-built and tested before release.
Conclusion
The Fitness Trainer Dashboard in Excel is the reporting layer every personal trainer and boutique fitness studio needs but rarely builds themselves — 6 KPIs, 15 charts, 5 analysis pages, and a pivot-table engine that refreshes every view in under 10 seconds. For $17.99 one-time, you get the analytics depth of a Mindbody enterprise add-on without the monthly invoice.
👉 Click here to Purchase the Fitness Trainer Dashboard in Excel
✅ Instant download · One-time payment · No subscription · No per-user fees · Lifetime access
🎥 Visit YouTube.com/@PK-AnExcelExpert for step-by-step video tutorials on building and customizing Excel dashboards.
📅 Last updated: April 2026