In today’s competitive retail and financial service market, pawnshops must track performance carefully. Many pawnshop owners manage daily transactions, gold loans, resale items, and customer relationships. However, without a structured system, business decisions become difficult. As a result, revenue growth slows down, risks increase, and targets remain unclear.
So, how can you monitor loan disbursement, inventory turnover, profit margin, and customer performance in one place?
You need a Pawnshops KPI Dashboard in Power BI.
Click to Purchases Pawnshops KPI Dashboard in Power BI
This ready-to-use dashboard helps you track all key performance indicators in one interactive Power BI file. Moreover, it allows you to compare Month-to-Date (MTD) and Year-to-Date (YTD) numbers instantly. Therefore, you gain complete control over operations, profitability, and target achievement.
In this detailed guide, you will learn:
-
What a Pawnshops KPI Dashboard in Power BI is
-
Why pawnshops need KPI tracking
-
Explanation of all 3 dashboard pages
-
Complete Excel data structure
-
Advantages of this dashboard
-
Best practices for implementation
-
Frequently Asked Questions with answers
Let us explore everything step by step.
What Is a Pawnshops KPI Dashboard in Power BI?
A Pawnshops KPI Dashboard in Power BI is a ready-to-use performance tracking system built inside Microsoft Power BI. It captures data from an Excel file and transforms it into meaningful visual insights.
Instead of checking multiple spreadsheets manually, you can:
-
Monitor MTD and YTD performance
-
Compare Current Year vs Previous Year
-
Identify target achievement quickly
-
Analyze KPI trends visually
-
Drill through KPI definitions instantly
Because Power BI updates visuals dynamically, you always see the latest numbers. Therefore, decision-making becomes faster and more accurate.
Why Do Pawnshops Need a KPI Dashboard?
Pawnshops deal with loans, collateral, resale products, and customer payments. Every day, transactions move quickly. However, if you do not track performance properly, you may face:
-
Poor loan recovery rates
-
Excess idle inventory
-
Low profit margins
-
Target misses
-
Reduced customer satisfaction
On the other hand, when you use a structured KPI dashboard:
-
You identify underperforming areas quickly
-
You improve financial planning
-
You reduce operational risk
-
You increase profitability
Therefore, a KPI dashboard does not only show numbers. Instead, it guides business strategy.
Overview of the Pawnshops KPI Dashboard in Power BI
This dashboard contains 3 interactive pages inside the Power BI desktop file:
-
Summary Page
-
KPI Trend Page
-
KPI Definition Page (Drill-through page)
Now, let us understand each page in detail.
Click to Purchases Pawnshops KPI Dashboard in Power BI
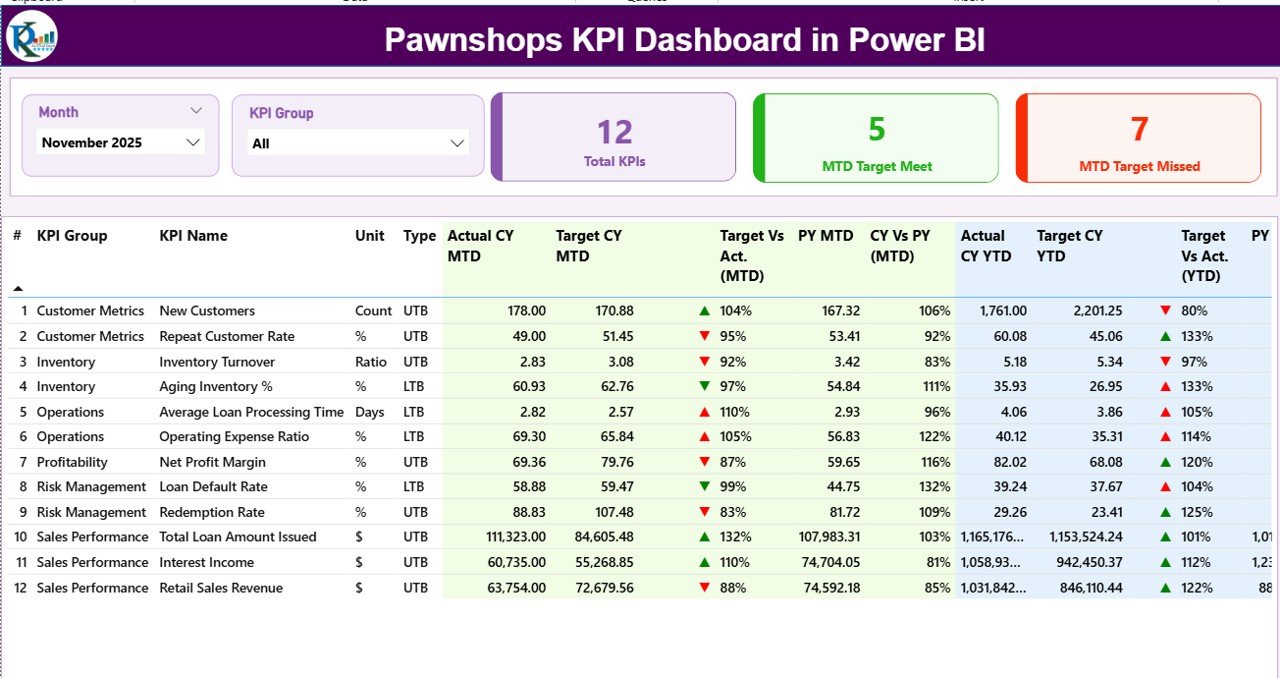
1️⃣ Summary Page – The Main Control Center
The Summary Page acts as the central control panel of the dashboard. Here, you can monitor all KPIs in one structured view.
What Do You See at the Top?
At the top section, you will find:
-
Month Slicer – Select any month
-
KPI Group Slicer – Filter KPIs by category
As soon as you select a month, the entire dashboard updates automatically. Therefore, you always analyze the correct period.
KPI Cards on the Summary Page
Below the slicers, you see three powerful KPI cards:
-
Total KPIs Count
-
MTD Target Meet Count
-
MTD Target Missed Count
These cards provide instant performance status. Because of this, management quickly understands how many KPIs perform well and how many require attention.
Detailed KPI Table – Complete Performance Breakdown
Below the cards, you see a detailed KPI table. This section shows full performance metrics.
Let us break down each column.
KPI Identification Columns
-
KPI Number – Sequence number
-
KPI Group – Category of KPI
-
KPI Name – Performance metric name
-
Unit – Measurement unit
-
Type – LTB (Lower the Better) or UTB (Upper the Better)
MTD (Month-to-Date) Performance Columns
-
Actual CY MTD – Current Year actual MTD value
-
Target CY MTD – Current Year target MTD value
-
MTD Icon (▲ / ▼)
-
Green ▲ shows target achieved
-
Red ▼ shows target missed
-
-
Target Vs Act. (MTD)
-
Formula:
Actual MTD / Target MTD -
Shows performance percentage
-
-
PY MTD – Previous Year MTD number
-
CY Vs PY (MTD)
-
Formula:
Current Year MTD / Previous Year MTD -
Shows growth percentage
-
YTD (Year-to-Date) Performance Columns
-
Actual CY YTD – Current Year YTD actual
-
Target CY YTD – Current Year YTD target
-
YTD Icon (▲ / ▼)
-
Green ▲ means target achieved
-
Red ▼ means target missed
-
-
Target Vs Act. (YTD)
-
Formula:
Actual YTD / Target YTD
-
-
PY YTD – Previous Year YTD value
-
CY Vs PY (YTD)
-
Formula:
Current Year YTD / Previous Year YTD
-
Because you see all this information in one table, performance tracking becomes simple and structured.
2️⃣ KPI Trend Page – Visual Performance Analysis
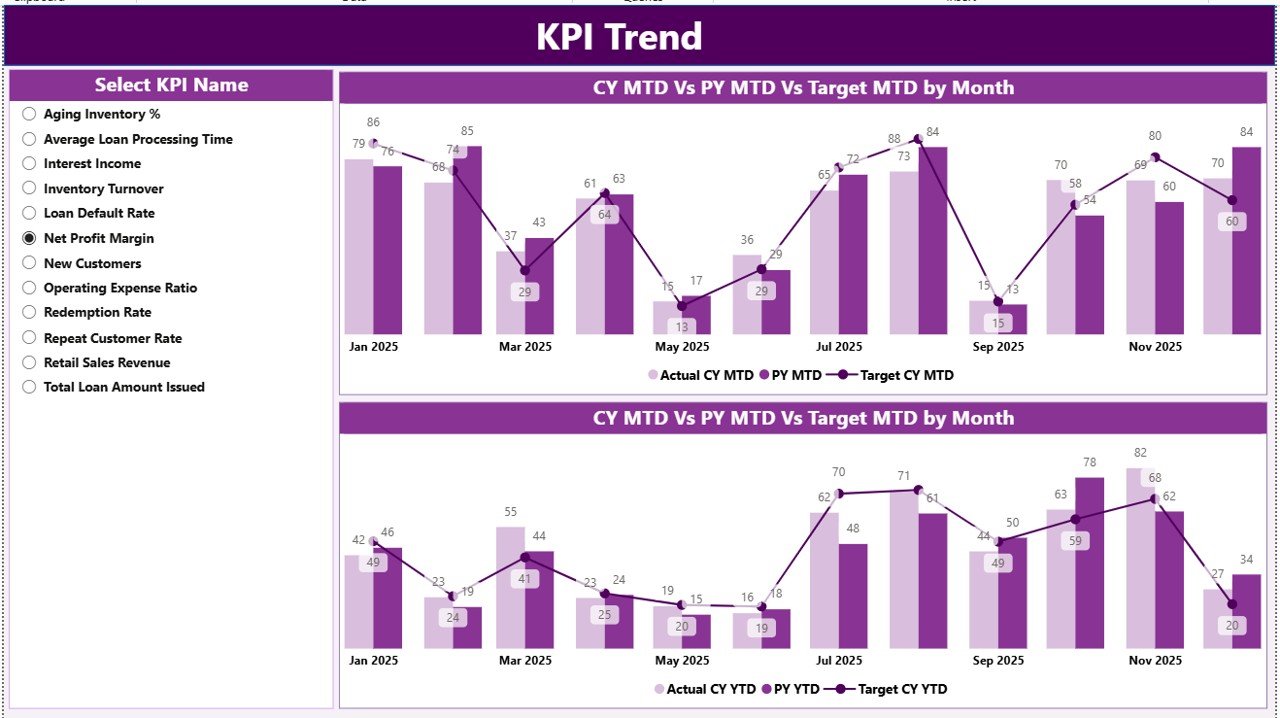
Numbers alone do not always tell the full story. Therefore, this page focuses on visual analysis.
What Does This Page Show?
This page includes:
-
2 Combo Charts
-
KPI Name Slicer on the left
When you select a KPI:
-
Chart 1 shows MTD comparison
-
Actual CY
-
Previous Year
-
Target
-
-
Chart 2 shows YTD comparison
-
Actual CY
-
Previous Year
-
Target
-
Because combo charts display columns and lines together, you can quickly compare targets and trends.
Why Is the Trend Page Important?
Trend analysis helps you:
-
Identify seasonal patterns
-
Detect sudden drops
-
Monitor steady growth
-
Improve forecasting
For example, if loan disbursement drops for two months, you can act immediately. Therefore, you prevent long-term losses.
3️⃣ KPI Definition Page – Drill-Through Details
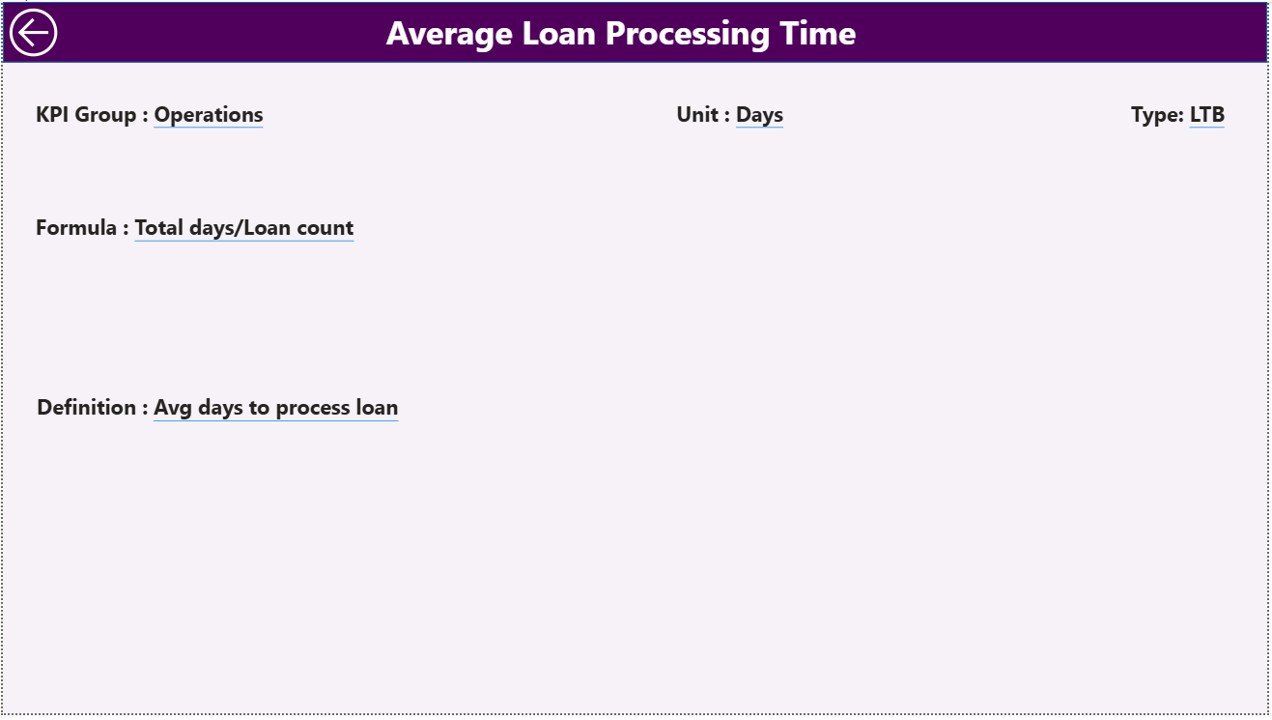
This page works as a hidden drill-through page.
From the Summary Page, you can right-click any KPI and drill through to this page.
Click to Purchases Pawnshops KPI Dashboard in Power BI
What Information Does It Show?
-
KPI Number
-
KPI Group
-
KPI Name
-
Unit
-
Formula
-
Definition
-
Type (LTB or UTB)
Because this page contains definitions and formulas, users understand how each KPI works. Therefore, confusion reduces and transparency improves.
To return, simply click the Back Button on the top left corner.
Excel Data Structure – Backend of the Dashboard
This dashboard uses Excel as a data source. You must fill three worksheets.
1️⃣ Input_Actual Sheet
In this sheet, enter:
-
KPI Name
-
Month (First date of month)
-
MTD Number
-
YTD Number
Important Rules:
-
Always use the first date of the month
-
Do not skip months
-
Maintain consistent KPI names
2️⃣ Input_Target Sheet
Here, enter:
-
KPI Name
-
Month (First date of month)
-
MTD Target
-
YTD Target
Because targets drive performance, ensure accuracy.
3️⃣ KPI Definition Sheet
Fill the following:
-
KPI Number
-
KPI Group
-
KPI Name
-
Unit
-
Formula
-
Definition
-
Type (LTB or UTB)
This sheet controls drill-through information.
What Are the Important KPIs for Pawnshops?
Although you can customize KPIs, common pawnshop KPIs include:
-
Loan Disbursement Value
-
Loan Recovery Rate
-
Inventory Turnover Ratio
-
Gross Profit Margin
-
Average Loan Size
-
Customer Repeat Rate
-
Default Rate (LTB)
-
Gold Appraisal Accuracy
-
Monthly Revenue
-
Operating Cost Ratio (LTB)
-
Net Profit
-
Loan Processing Time (LTB)
You can categorize them under:
-
Financial KPIs
-
Operational KPIs
-
Customer KPIs
-
Risk KPIs
Advantages of Pawnshops KPI Dashboard in Power BI
Now, let us understand why this dashboard adds strong value.
1️⃣ Real-Time Performance Tracking
As soon as you update Excel data, Power BI refreshes visuals. Therefore, you always see current numbers.
2️⃣ Target Monitoring Made Simple
Icons clearly show whether KPIs meet targets. Because of visual indicators, management reacts quickly.
3️⃣ Easy MTD & YTD Comparison
You can compare short-term and long-term performance instantly.
4️⃣ Previous Year Benchmarking
Year-over-year comparison helps measure growth.
5️⃣ Better Decision-Making
When you see structured numbers, you take informed decisions.
6️⃣ Drill-Through Transparency
Users understand KPI formulas clearly. Therefore, confusion disappears.
7️⃣ Clean and Professional Design
Power BI provides modern visuals. As a result, reporting becomes impressive and clear.
How Does This Dashboard Improve Pawnshop Profitability?
Let us connect KPIs with business results.
-
When you track loan recovery rate, you reduce defaults.
-
When you monitor inventory turnover, you avoid stock blockage.
-
When you analyze profit margin, you adjust pricing strategies.
-
When you measure operating cost ratio, you control expenses.
Because you monitor every important metric, profitability increases steadily.
Best Practices for the Pawnshops KPI Dashboard in Power BI
To get maximum value, follow these best practices.
1️⃣ Maintain Accurate Data Entry
Always update Excel sheets monthly. Moreover, avoid duplicate KPI names.
2️⃣ Review KPIs Monthly
Do not wait for year-end analysis. Instead, review KPIs every month.
3️⃣ Focus on LTB and UTB Correctly
For LTB KPIs (Lower the Better):
-
Example: Default Rate
-
Lower value indicates better performance
For UTB KPIs (Upper the Better):
-
Example: Revenue
-
Higher value indicates better performance
4️⃣ Use KPI Groups Smartly
Click to Purchases Pawnshops KPI Dashboard in Power BI
Create groups like:
-
Financial
-
Operational
-
Risk
-
Customer
Because grouping improves clarity, analysis becomes easier.
5️⃣ Train Your Team
Ensure staff understands KPI definitions. Therefore, they align their work with business goals.
6️⃣ Monitor Trends, Not Just Numbers
Instead of focusing only on one month, analyze trends. Because trends show direction, you make better forecasts.
Who Can Use This Dashboard?
This dashboard suits:
-
Pawnshop Owners
-
Multi-Branch Pawnshop Chains
-
Financial Managers
-
Operations Managers
-
Business Analysts
Even small pawnshops can benefit because the system remains simple and structured.
How to Implement the Pawnshops KPI Dashboard Successfully?
Follow these steps:
-
Identify KPIs relevant to your pawnshop
-
Define clear targets
-
Prepare historical data
-
Fill Excel sheets carefully
-
Connect Excel to Power BI
-
Refresh data monthly
-
Review performance regularly
Because implementation remains simple, you can start quickly.
Conclusion
Pawnshops operate in a fast-moving environment. Without structured tracking, performance gaps increase. However, when you use a Pawnshops KPI Dashboard in Power BI, you gain complete visibility.
This dashboard:
-
Tracks MTD and YTD numbers
-
Compares Current Year vs Previous Year
-
Shows target achievement clearly
-
Provides drill-through definitions
-
Uses Excel as a flexible backend
Therefore, you improve decision-making, reduce risk, and increase profitability.
If you want to manage your pawnshop like a professional financial institution, this dashboard provides the right solution.
Frequently Asked Questions (FAQs)
1️⃣ What is the purpose of a Pawnshops KPI Dashboard in Power BI?
It helps pawnshops track financial, operational, and risk KPIs in one interactive system.
2️⃣ Can I customize KPIs in this dashboard?
Yes, you can modify KPI names, targets, and groups according to your business needs.
3️⃣ What does LTB and UTB mean?
-
LTB means Lower the Better
-
UTB means Upper the Better
4️⃣ How often should I update the Excel data?
You should update data monthly. However, you can update more frequently if required.
5️⃣ Do I need advanced Power BI knowledge to use this dashboard?
No. You only need basic Excel data entry skills. The dashboard updates automatically after refresh.
6️⃣ Can I use this dashboard for multiple branches?
Yes. You can add branch information in Excel and filter using slicers.
7️⃣ Why is MTD and YTD comparison important?
MTD shows short-term performance. YTD shows overall yearly progress. Therefore, both provide balanced insight.
Visit our YouTube channel to learn step-by-step video tutorials