Managing port projects demands precision, speed, and complete visibility. Since ports operate with complex infrastructure, multiple contractors, strict timelines, and high financial stakes, tracking project performance manually often leads to delays, cost overruns, and poor decision-making.
That is exactly where the Port Project Management KPI Dashboard in Power BI plays a vital role.
This in-depth guide explains everything about the Port Project Management KPI Dashboard in Power BI, including its structure, features, advantages, best practices, and real-world benefits. Moreover, this article uses clear language, simple explanations, and practical insights so anyone can understand and implement the dashboard easily.
Click to buy Port Project Management KPI Dashboard in Power BI
What Is a Port Project Management KPI Dashboard in Power BI?
A Port Project Management KPI Dashboard in Power BI is an interactive and data-driven reporting tool designed to monitor, analyze, and evaluate project performance across port operations.
Instead of managing scattered Excel files or manual reports, this dashboard consolidates all key performance indicators (KPIs) into a single Power BI report. As a result, port managers can track project progress, monitor targets, identify risks, and take corrective actions in real time.
Moreover, this dashboard uses Excel as a data source, which makes data entry easy and eliminates complex database setups.
Why Do Ports Need a Project Management KPI Dashboard?
Ports handle large-scale projects such as:
- Terminal expansion
- Infrastructure development
- Equipment installation
- IT system upgrades
- Maintenance and modernization projects
Because of this complexity, project managers need complete visibility into performance metrics.
A Port Project Management KPI Dashboard helps organizations:
- Track progress against targets
- Monitor delays and bottlenecks
- Compare actual vs planned performance
- Improve accountability
- Enhance decision-making
Therefore, ports that use KPI dashboards achieve better control, higher efficiency, and improved project success rates.
Overview of the Port Project Management KPI Dashboard
The Port Project Management KPI Dashboard in Power BI comes as a ready-to-use solution with structured reporting and interactive visuals.
Key Highlights
- Built in Power BI Desktop
- Uses Excel as data source
- Fully dynamic and interactive
- Easy to customize
- Suitable for all port project types
- Designed for operational and strategic tracking
Dashboard Structure and Pages
The dashboard consists of three powerful pages, each designed for a specific purpose.
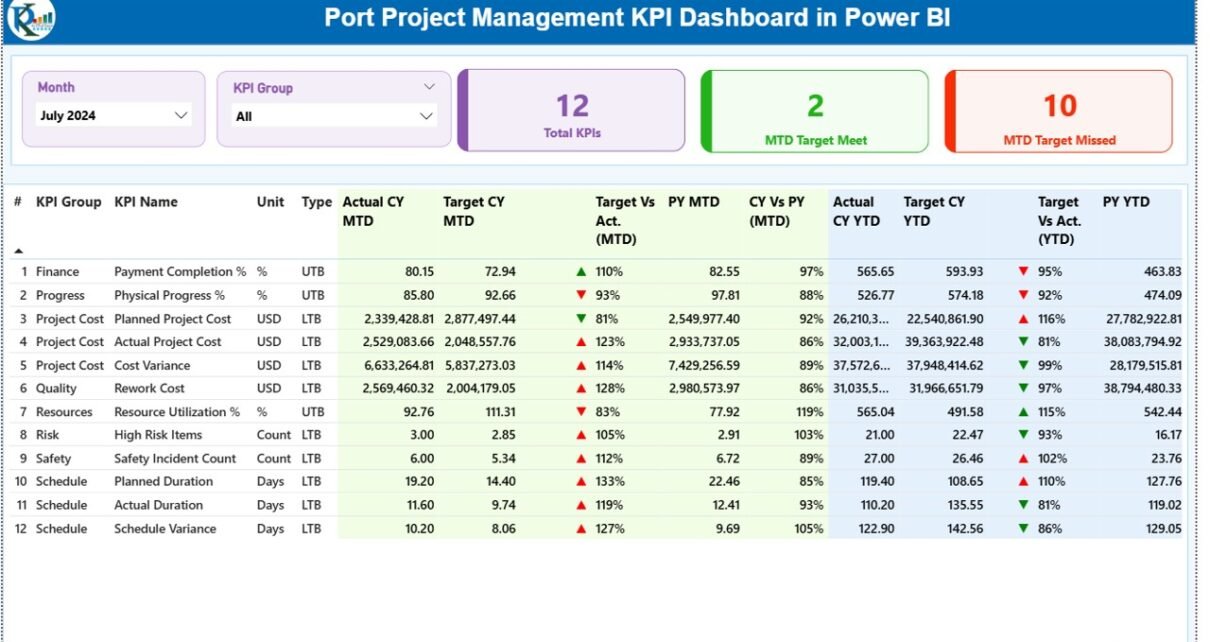
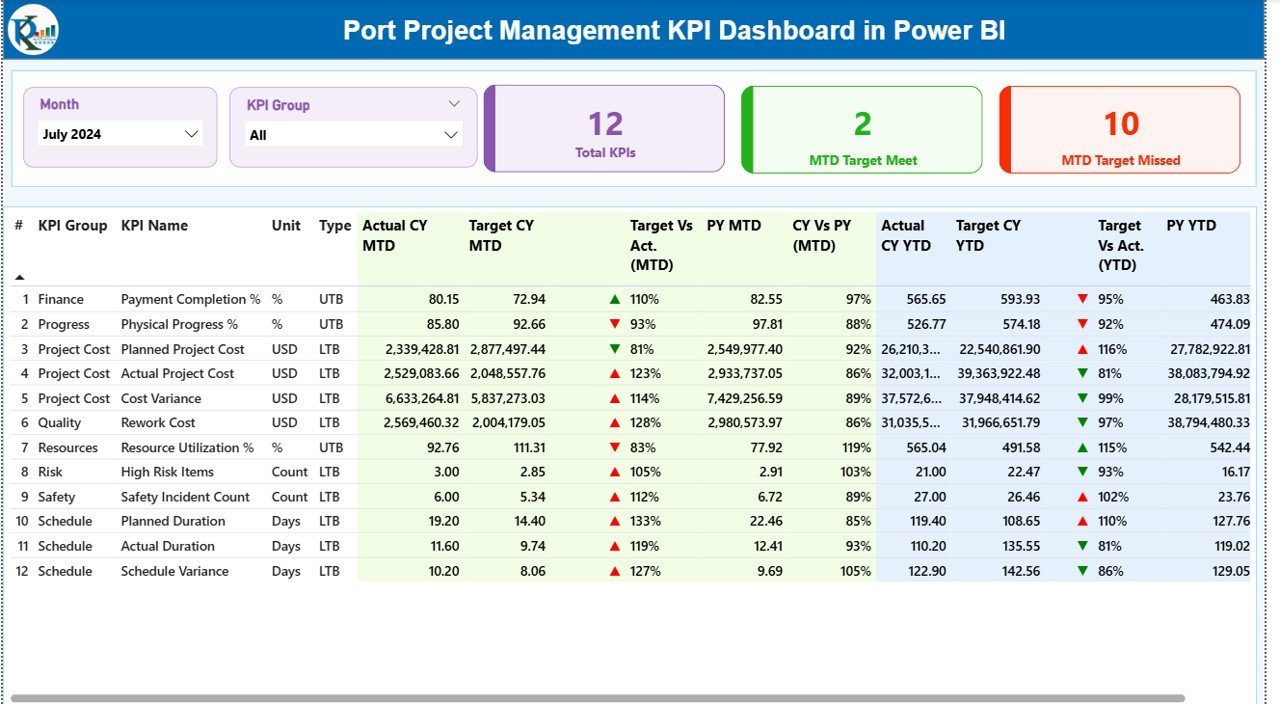
Summary Page – Central Performance View
The Summary Page acts as the main control center of the dashboard.
Key Elements on the Summary Page
Month and KPI Group Slicer
- Allows users to filter data by month
- Enables filtering by KPI category
- Instantly updates all visuals
KPI Summary Cards
The top section displays three important KPI cards:
- Total KPIs Count – Shows total tracked KPIs
- MTD Target Met – KPIs that achieved targets
- MTD Target Missed – KPIs below target
These cards help managers quickly assess overall performance.
Detailed KPI Table Explanation
Below the KPI cards, the dashboard displays a detailed performance table with the following columns:
KPI Number
- Displays the unique sequence number of each KPI
KPI Group
- Shows the category or department of the KPI
KPI Name
- Displays the name of the KPI
Unit
- Defines the measurement unit (%, Hours, Days, Cost, etc.)
Type (LTB / UTB)
- LTB (Lower the Better) – Example: Cost, Delay
- UTB (Upper the Better) – Example: Productivity, Completion Rate
Performance Tracking Metrics
Actual CY MTD
- Displays the actual value for the current month
Target CY MTD
- Shows the planned target for the month
MTD Status Icon
- ▲ Green arrow → Target achieved
- ▼ Red arrow → Target missed
Target vs Actual (MTD)
- Calculated using:
Actual / Target
PY MTD
- Shows the same month’s performance from the previous year
CY vs PY (MTD)
- Compares current and previous year performance
- Formula:
Current Year MTD / Previous Year MTD
Year-to-Date Performance Section
Actual CY YTD
- Displays cumulative performance for the year
Target CY YTD
- Shows annual target values
YTD Status Icon
- Indicates performance using green and red arrows
Target vs Actual (YTD)
- Formula:
Actual YTD / Target YTD
PY YTD
- Displays last year’s YTD value
CY vs PY (YTD)
- Measures growth or decline compared to last year
Click to buy Port Project Management KPI Dashboard in Power BI
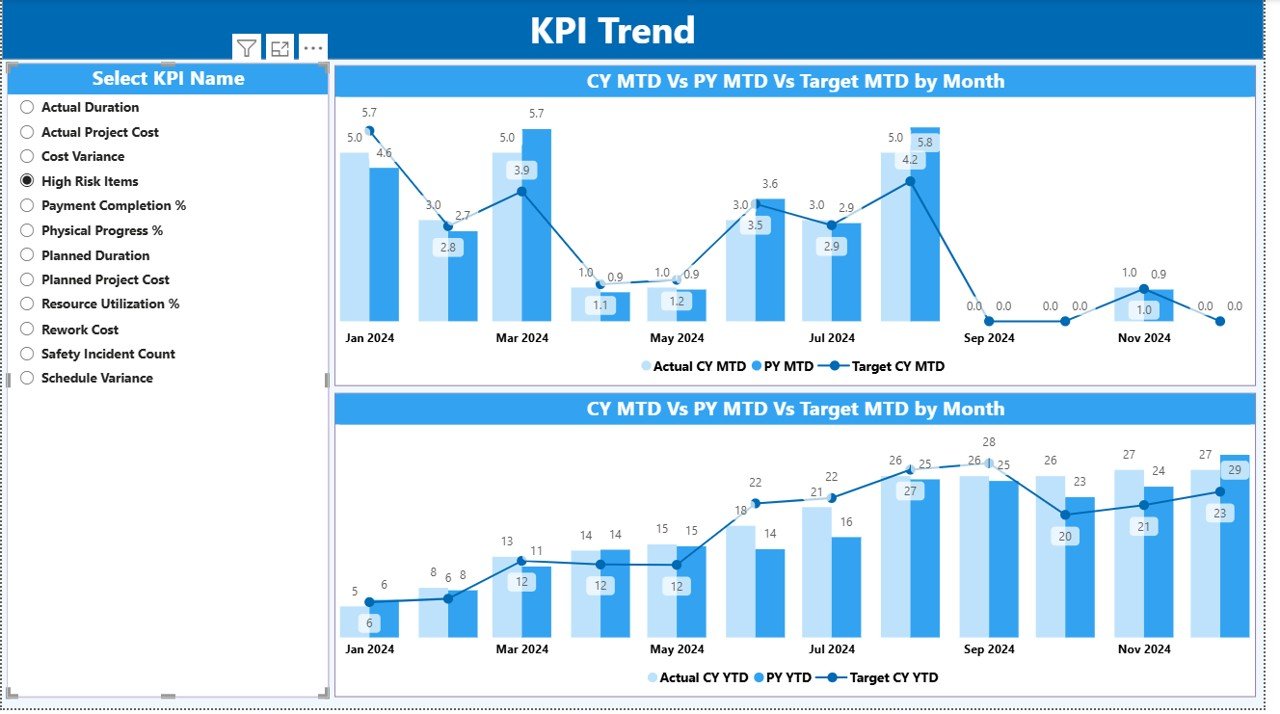
KPI Trend Page – Performance Analysis Over Time
The KPI Trend Page helps users analyze performance trends visually.
Key Features of the Trend Page
- Interactive KPI slicer on the left
- Two dynamic combo charts
Comparison of:
Current Year
Previous Year
Target
Charts Included
MTD Trend Chart
YTD Trend Chart
These charts allow managers to:
- Identify trends
- Spot deviations early
- Analyze seasonal behavior
- Monitor performance consistency
Click to buy Port Project Management KPI Dashboard in Power BI
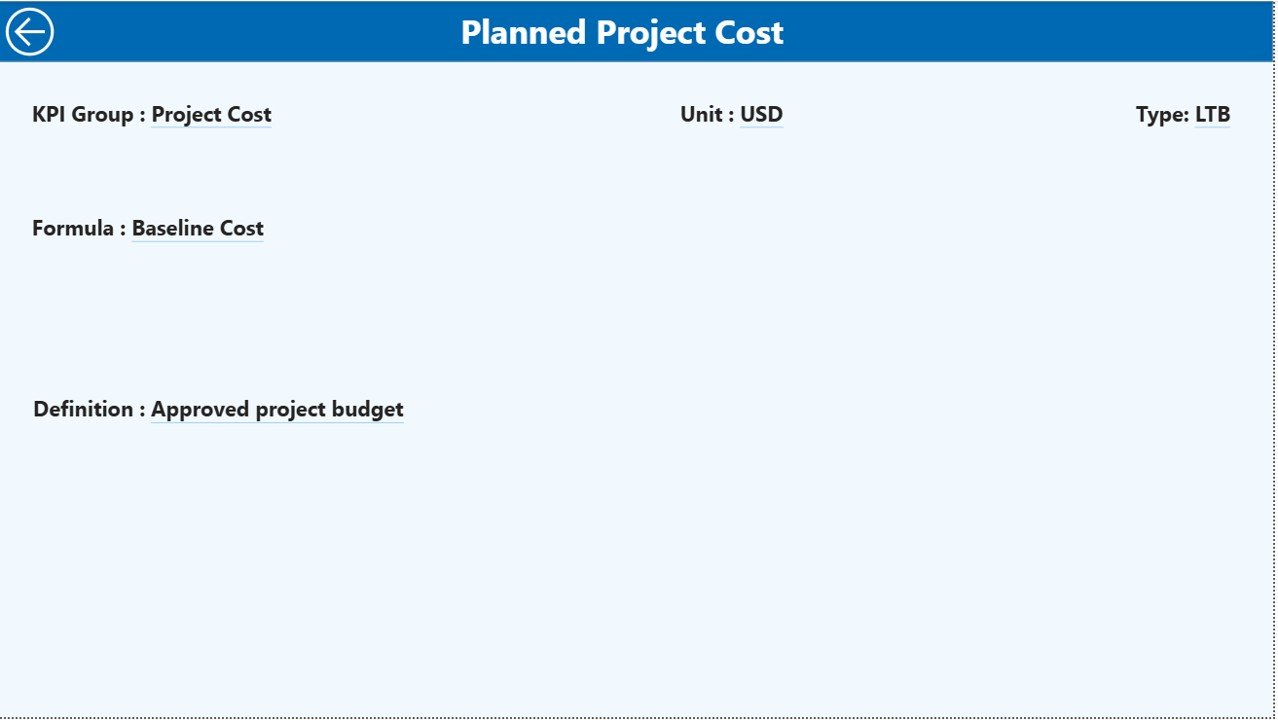
KPI Definition Page – Drill-Through Insights
The KPI Definition Page provides detailed information about each KPI.
Key Details Available
- KPI Number
- KPI Group
- KPI Name
- Unit
- Formula
- Definition
- KPI Type (LTB or UTB)
This page remains hidden and opens through drill-through from the Summary Page.
Users can return to the main page using the Back button at the top-left corner.
Click to buy Port Project Management KPI Dashboard in Power BI
Excel Data Structure Used in the Dashboard
The dashboard uses an Excel file as the data source, which makes data entry easy and flexible.
Input_Actual Sheet
This sheet captures actual performance data.
Fields included:
- KPI Name
- Month (First date of the month)
- MTD Value
- YTD Value
Users simply enter monthly values, and the dashboard updates automatically.
Input_Target Sheet
This sheet stores target values.
Fields included:
- KPI Name
- Month
- Target MTD
- Target YTD

Click to buy Port Project Management KPI Dashboard in Power BI
KPI Definition Sheet
This sheet defines each KPI.
Fields included:
- KPI Number
- KPI Group
- KPI Name
- Unit
- Formula
- Definition
- Type (LTB / UTB)
Advantages of Port Project Management KPI Dashboard
Centralized Performance Tracking
All KPIs remain available in one dashboard, which improves visibility.
Faster Decision-Making
Real-time insights allow managers to act quickly.
Improved Project Control
Users can track targets, delays, and performance gaps easily.
Data-Driven Planning
Historical data supports better planning and forecasting.
Easy to Use
Since the dashboard uses Excel and Power BI, users do not need advanced technical skills.
Professional Reporting
The dashboard provides executive-level visuals suitable for presentations.
Best Practices for Using Port Project Management KPI Dashboard
Define Clear KPIs
Always use measurable and meaningful KPIs aligned with port objectives.
Update Data Regularly
Update actual and target data monthly for accurate results.
Use Standard Units
Maintain consistency in KPI units for reliable analysis.
Review Trends Periodically
Analyze MTD and YTD trends to identify risks early.
Train Users
Train staff to understand KPI logic and dashboard navigation.
Maintain Clean Data
Avoid missing or incorrect values to ensure accuracy.
Who Can Use This Dashboard?
This dashboard works perfectly for:
- Port Authorities
- Project Managers
- Operations Teams
- Planning Departments
- Engineering Teams
- PMO Teams
- Logistics and Infrastructure Managers
How Does This Dashboard Improve Project Performance?
The dashboard improves performance by:
- Highlighting delays instantly
- Comparing actual vs target values
- Showing performance trends
- Supporting proactive decisions
- Improving accountability
- Enhancing transparency
As a result, port projects stay on track and within budget.
Conclusion
The Port Project Management KPI Dashboard in Power BI serves as a powerful performance monitoring tool for modern port operations. It combines structured data, dynamic visuals, and smart KPIs into a single platform.
Since the dashboard uses Excel as a data source, it remains easy to maintain and highly flexible. Moreover, its clear design, detailed KPI tracking, and trend analysis make it ideal for both operational teams and management.
If you want better control, improved transparency, and data-driven decision-making in port projects, this dashboard offers the perfect solution.
Frequently Asked Questions (FAQs)
- What is a Port Project Management KPI Dashboard?
It is a Power BI dashboard that tracks project performance using KPIs such as targets, actuals, and trends.
- Which tool is used to build this dashboard?
The dashboard uses Power BI Desktop with Excel as the data source.
- Can I customize the KPIs?
Yes. You can easily modify KPIs, formulas, and targets in the Excel file.
- Does the dashboard support monthly and yearly tracking?
Yes. It supports both MTD (Month-to-Date) and YTD (Year-to-Date) analysis.
- Is technical knowledge required to use this dashboard?
No. Basic Excel and Power BI knowledge is enough.
- Can I use this dashboard for other industries?
Yes. You can easily customize it for construction, logistics, manufacturing, or IT projects.
- How often should I update the data?
You should update the data monthly or as per project reporting cycles.
Visit our YouTube channel to learn step-by-step video tutorials
Watch the step-by-step video tutorial:
Click to buy Port Project Management KPI Dashboard in Power BI