In today’s fast-changing energy world, renewable infrastructure projects continue to grow rapidly. Governments invest heavily. Private investors fund large solar and wind farms. Meanwhile, project managers handle multiple contracts, regions, and energy sources at the same time.
However, many organizations still struggle to track performance clearly. They depend on scattered Excel sheets. They review static reports. As a result, they miss insights that could improve ROI and reduce costs.
So, how can you monitor renewable infrastructure projects in one powerful system?
Click to Purchases Renewable Infrastructure Projects Dashboard in Power BI
You need a Renewable Infrastructure Projects Dashboard in Power BI.
This article explains everything step by step. You will learn:
-
What this dashboard is
-
Why renewable project tracking matters
-
Detailed explanation of all 5 pages
-
Advantages of Renewable Infrastructure Projects Dashboard in Power BI
-
Best Practices for the Renewable Infrastructure Projects Dashboard in Power BI
-
Frequently Asked Questions with Answers
Let us explore everything in detail.
What Is a Renewable Infrastructure Projects Dashboard in Power BI?
A Renewable Infrastructure Projects Dashboard in Power BI is an interactive reporting solution built in Microsoft Power BI Desktop. It helps you track, analyze, and optimize renewable energy projects such as:
-
Solar power plants
-
Wind farms
-
Hydropower projects
-
Biomass facilities
-
Geothermal installations
Instead of reviewing multiple spreadsheets, you can:
-
Track ROI % instantly
-
Monitor project status
-
Analyze operating costs
-
Compare investment by region
-
Evaluate revenue by project type
-
Measure government subsidies
-
Identify high-performing contracts
Therefore, you gain full visibility into your renewable infrastructure portfolio.
Why Do Renewable Infrastructure Projects Need a Smart Dashboard?
Renewable projects involve complex financial and operational metrics. Teams manage budgets, contracts, energy sources, and regulatory compliance simultaneously.
However, when data stays disconnected, decision-makers struggle.
Common Challenges Without a Dashboard
-
❌ No real-time ROI visibility
-
❌ Poor cost tracking
-
❌ Delayed reporting
-
❌ Limited regional comparison
-
❌ No consolidated view of subsidies
-
❌ Difficulty identifying profitable contracts
On the other hand, when you implement a Power BI dashboard, you:
-
Gain centralized reporting
-
Improve financial control
-
Enhance strategic planning
-
Increase transparency
-
Support data-driven investment decisions
As a result, your renewable projects become more profitable and efficient.
Detailed Explanation of All 5 Pages
Click to Purchases Renewable Infrastructure Projects Dashboard in Power BI
Now, let us explore each page of the Renewable Infrastructure Projects Dashboard in Power BI.
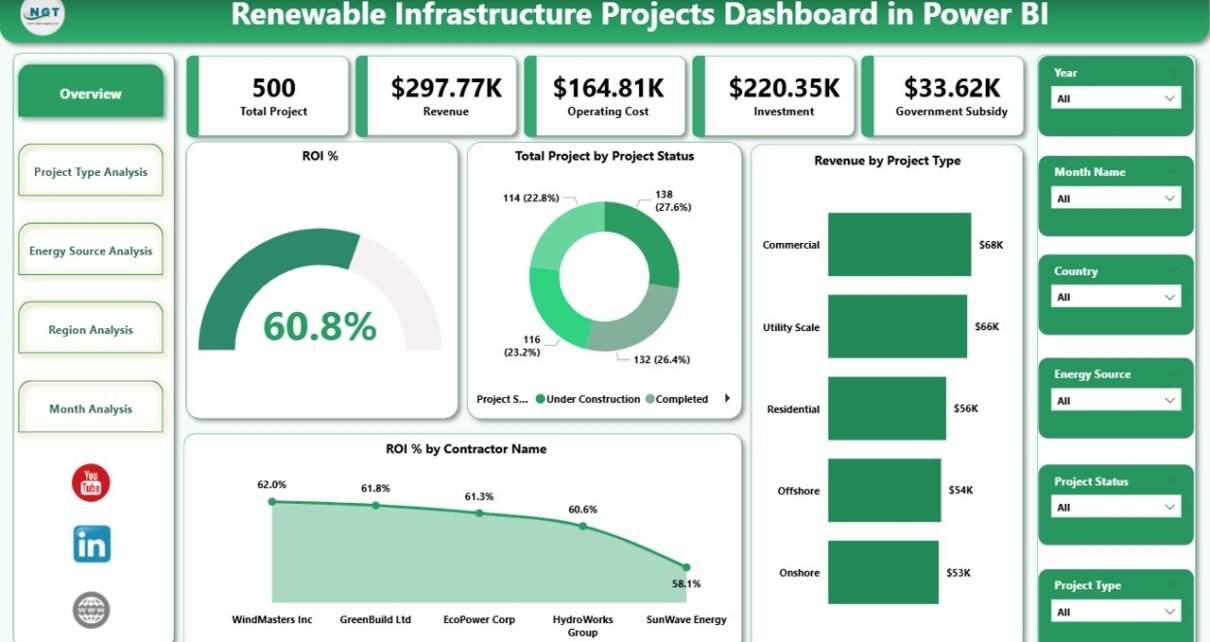
1. Overview Page – How Can You See the Big Picture Instantly?
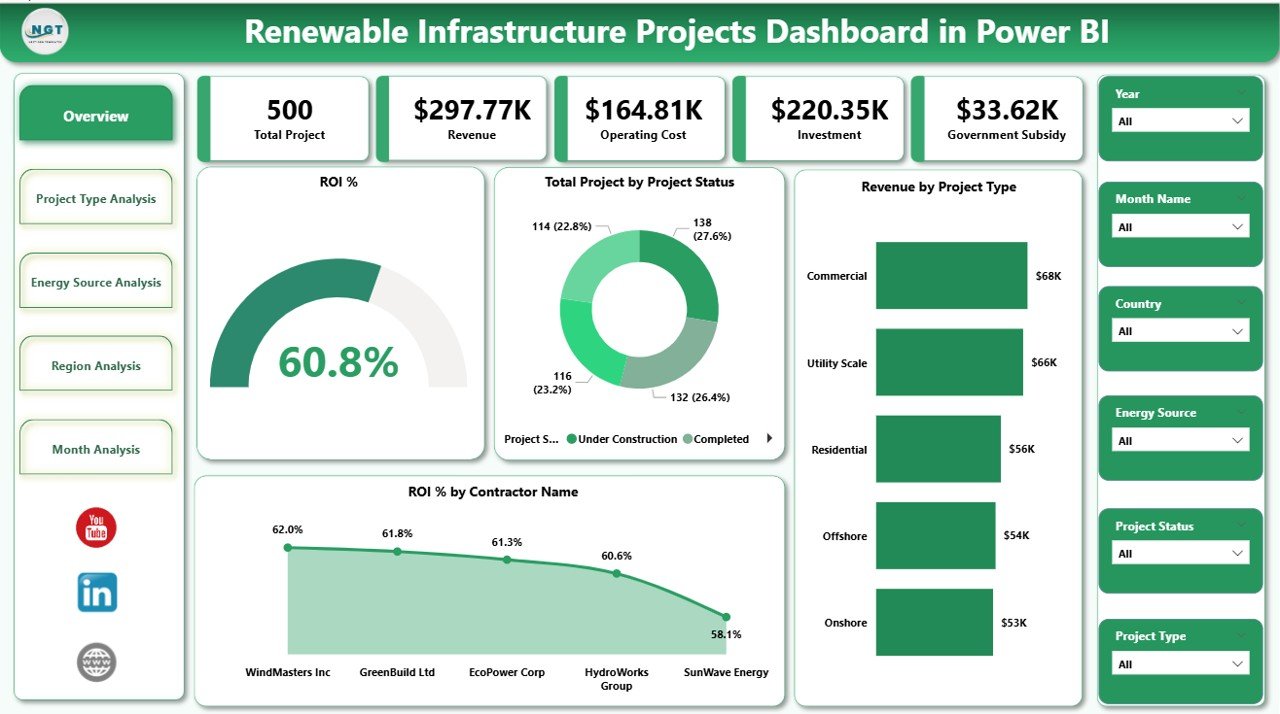
The Overview Page serves as the command center of the dashboard.
Here, you can quickly understand overall performance.
Key Elements on the Overview Page
1️⃣ KPI Cards
You get 5 powerful cards that highlight:
-
ROI %
-
Total Projects by Project Status
-
Revenue by Project Type
-
ROI % by Contract Name
-
Total Investment
Because these KPIs appear at the top, you can immediately see whether performance aligns with expectations.
2️⃣ Interactive Slicers
You can filter data by:
-
Year
-
Project Type
-
Region
-
Energy Source
-
Contract Name
Therefore, you can drill down instantly without switching pages.
3️⃣ Revenue by Project Type Chart
This visual shows which project types generate the highest revenue. For example:
-
Solar vs Wind
-
Utility-scale vs Residential
-
Onshore vs Offshore
As a result, you can allocate resources strategically.
4️⃣ ROI % by Contract Name
This chart identifies high-performing and underperforming contracts.
If a contract delivers strong ROI, you can expand similar agreements. On the other hand, if ROI declines, you can investigate immediately.
2. Project Type Analysis – Which Project Type Delivers Maximum Profit?
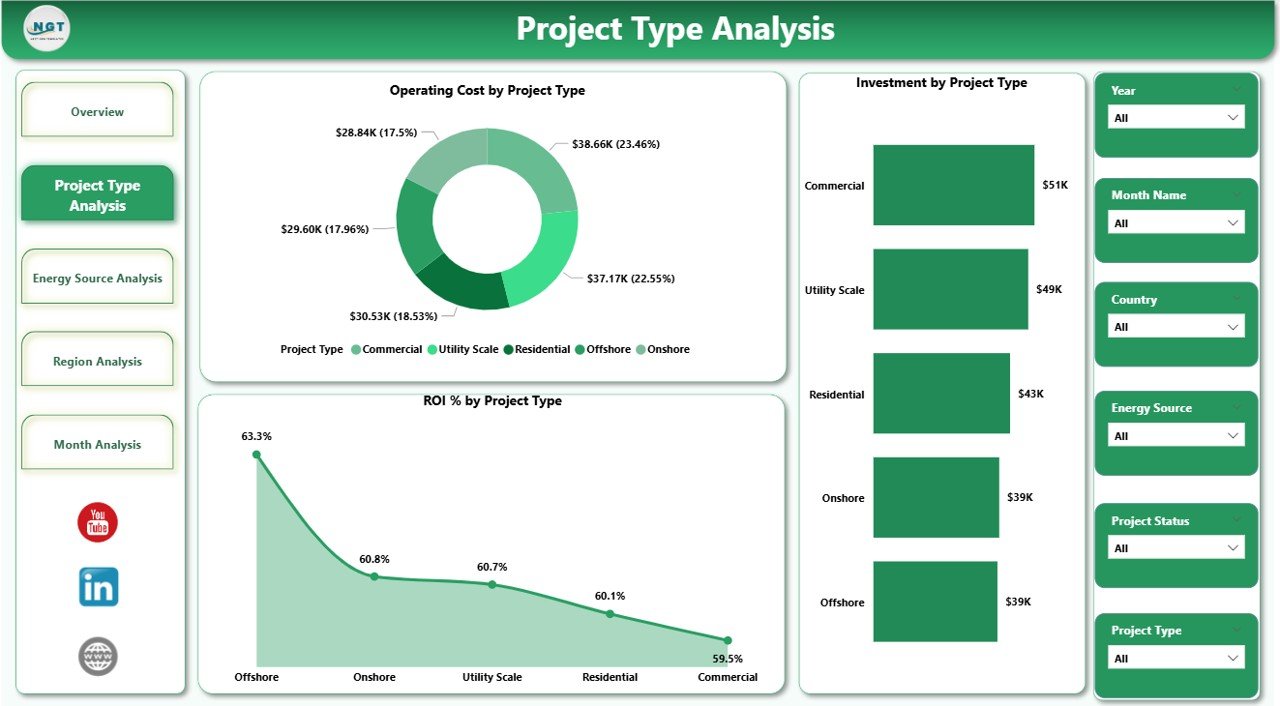
The Project Type Analysis Page helps you evaluate financial performance by project category.
Charts Available
-
Operating Cost by Project Type
-
Investment by Project Type
-
ROI % by Project Type
Why This Page Matters
Different renewable projects behave differently. For example:
-
Solar projects may require high initial investment but lower operating cost.
-
Wind farms may involve higher maintenance cost.
Therefore, this page helps you:
-
Compare cost structures
-
Evaluate return on capital
-
Identify most profitable project categories
Consequently, leadership teams can optimize capital allocation.
3. Energy Source Analysis – Which Energy Source Performs Best?
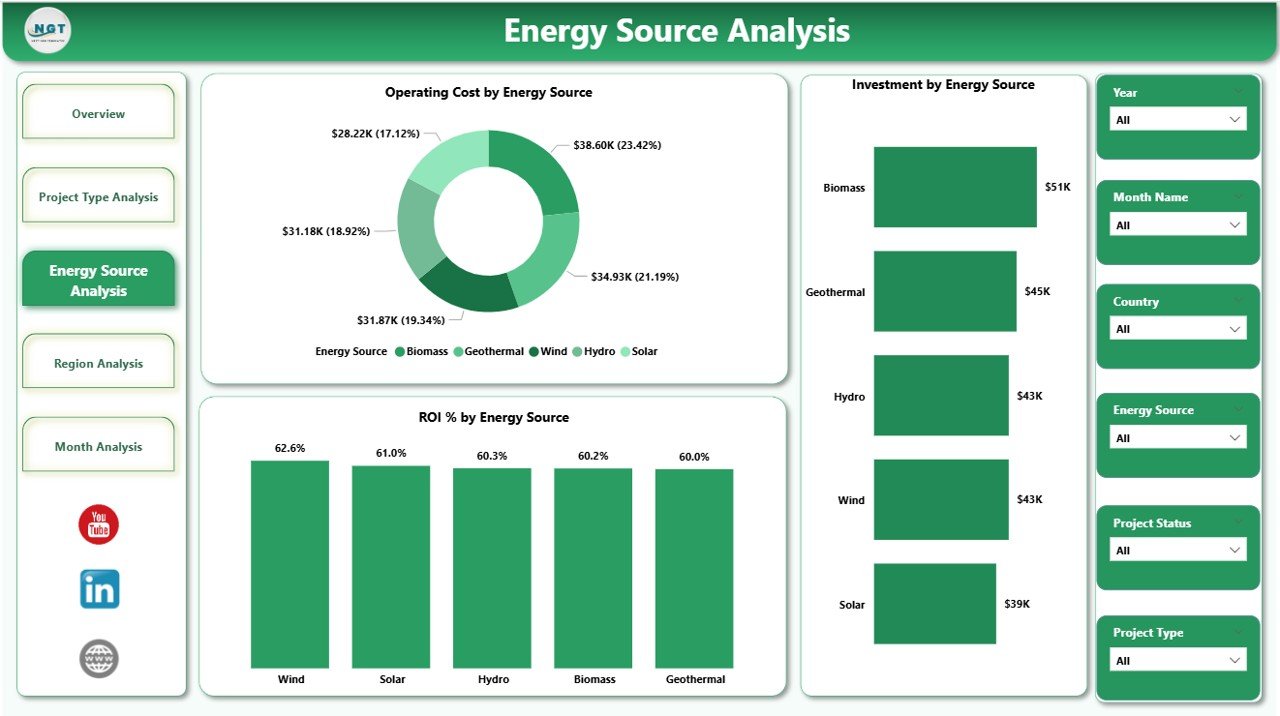
Renewable infrastructure includes multiple energy sources. However, each source performs differently based on geography and policy.
This page provides:
-
Operating Cost by Energy Source
-
Investment by Energy Source
-
ROI % by Energy Source
What Insights Can You Gain?
-
Does solar deliver higher ROI than wind?
-
Does hydropower require higher maintenance?
-
Which energy source attracts more subsidy?
Because the dashboard visualizes this data clearly, you can shift investment toward better-performing sources.
Moreover, you can reduce exposure to low-performing energy assets.
Click to Purchases Renewable Infrastructure Projects Dashboard in Power BI
4. Region Analysis – Which Region Generates Maximum Returns?
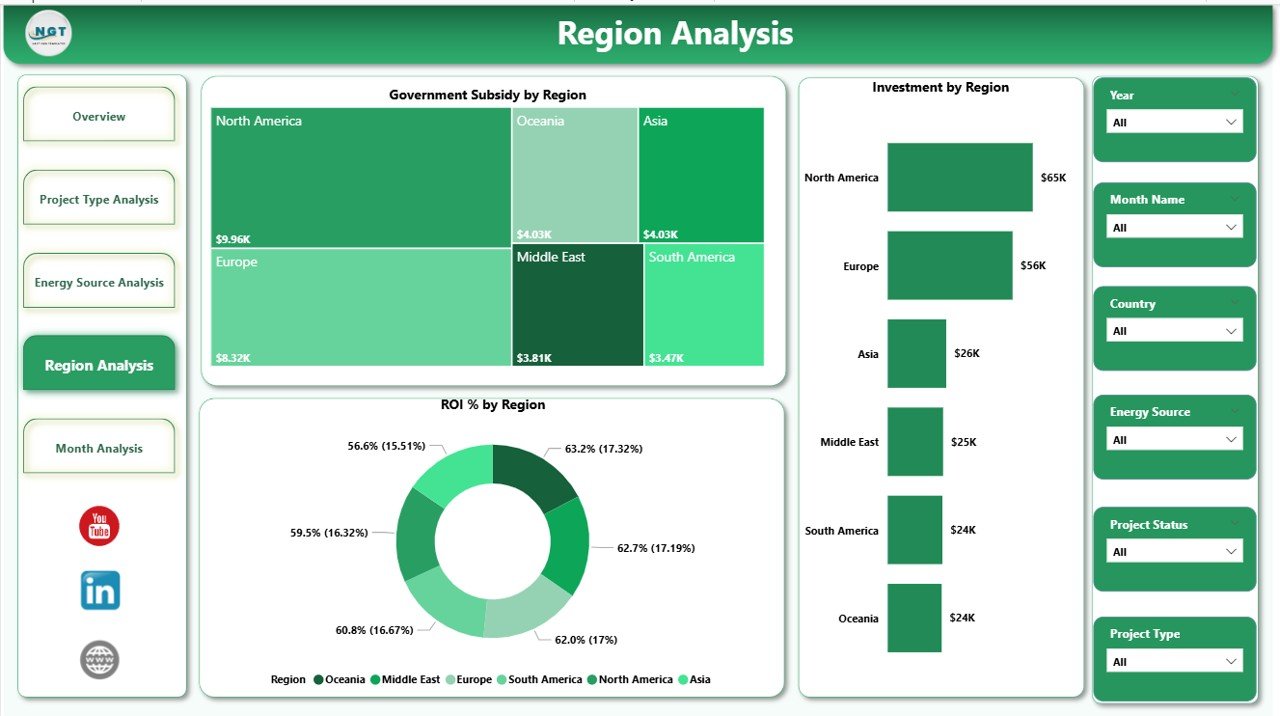
Renewable infrastructure performance often depends on regional policies, climate, and subsidies.
Therefore, regional comparison becomes critical.
Charts Included
-
Government Subsidy by Region
-
Investment by Region
-
ROI % by Region
Key Benefits
-
Identify high-subsidy regions
-
Compare ROI across geographies
-
Analyze regional cost differences
-
Optimize expansion strategy
For example, if one region offers strong subsidies and high ROI, you can increase investment there. Meanwhile, if another region shows weak returns, you can reassess your strategy.
5. Month Analysis – How Does Performance Change Over Time?
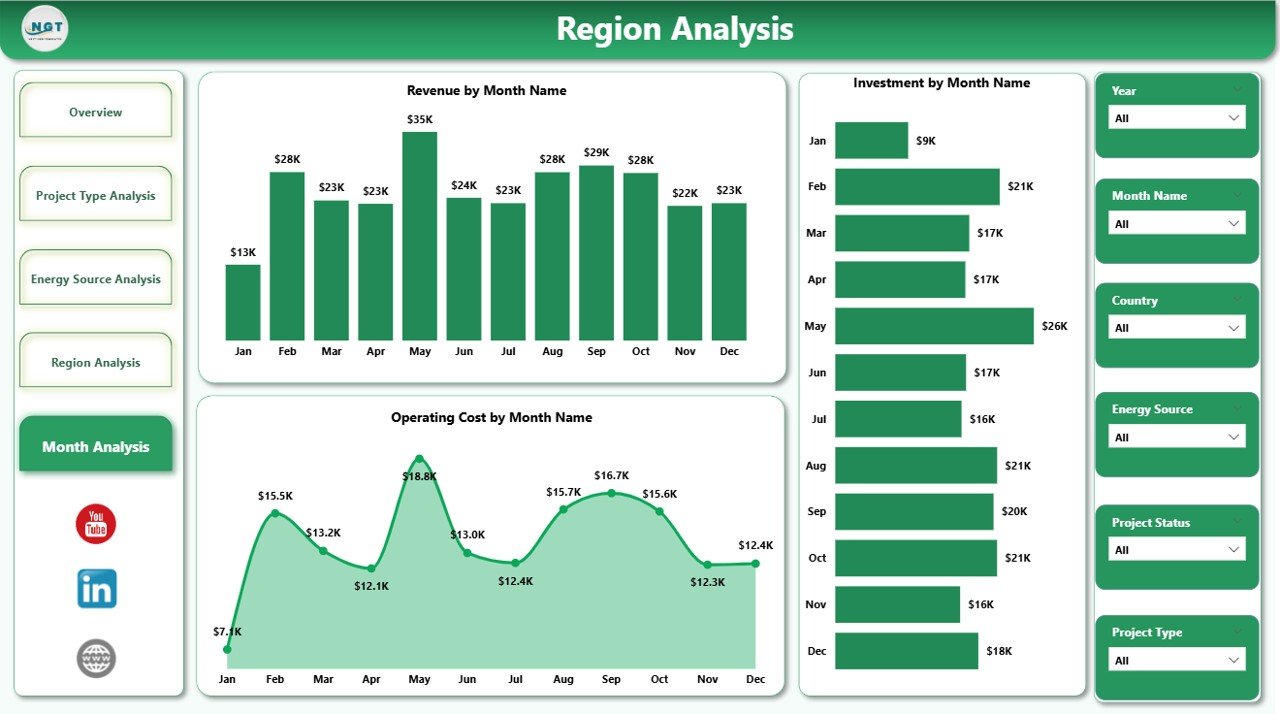
The Month Analysis Page focuses on time-based performance tracking.
This page typically includes:
-
Monthly Investment Trend
-
Monthly Operating Cost Trend
-
Monthly ROI % Trend
-
Revenue Trend Over Time
Why Is Monthly Tracking Important?
-
Detect seasonal trends
-
Monitor project delays
-
Track cost fluctuations
-
Improve forecasting accuracy
Therefore, instead of reacting late, you can take proactive action.
What Key Metrics Should You Track in Renewable Infrastructure Projects?
To maximize value, you should monitor:
-
ROI %
-
Total Investment
-
Operating Cost
-
Revenue
-
Government Subsidy
-
Project Completion Status
-
Contract Performance
-
Energy Source Performance
-
Regional Performance
When you combine all these metrics into Power BI, you gain a 360-degree view.
Advantages of Renewable Infrastructure Projects Dashboard in Power BI
Now let us discuss the major advantages.
1. Real-Time Financial Visibility
You can track ROI and investment instantly. Therefore, you can make faster decisions.
2. Centralized Data Control
Instead of managing multiple files, you consolidate everything in one dashboard.
3. Improved Capital Allocation
Because you see ROI by project type and region, you can invest wisely.
4. Better Risk Management
You identify low-performing contracts quickly. Consequently, you reduce financial risk.
5. Strategic Expansion Planning
You analyze regional and energy source performance clearly. Therefore, expansion becomes data-driven.
6. Enhanced Stakeholder Reporting
You can share interactive reports with investors, executives, and regulators.
7. Performance Transparency
Teams gain clarity. Accountability improves.
How Does Power BI Improve Renewable Infrastructure Reporting?
Power BI provides:
-
Interactive visuals
-
Drill-down capabilities
-
Automated refresh
-
Dynamic filtering
-
Cloud sharing options
-
Secure data access
Moreover, Power BI allows you to connect with:
-
ERP systems
-
Financial databases
-
Excel files
-
Cloud storage
-
API-based data sources
Therefore, you can integrate real-time data seamlessly.
Best Practices for the Renewable Infrastructure Projects Dashboard in Power BI
Click to Purchases Renewable Infrastructure Projects Dashboard in Power BI
To maximize impact, follow these best practices:
1. Define Clear KPIs
Start with financial and operational KPIs. Avoid unnecessary metrics.
2. Maintain Data Accuracy
Validate financial data before loading it into Power BI.
3. Use Consistent Data Structure
Standardize project names, regions, and contract types.
4. Apply Logical Filters
Use slicers for:
-
Year
-
Region
-
Energy Source
-
Project Type
This improves user experience.
5. Focus on Visual Clarity
Avoid clutter. Use clean visuals. Highlight key KPIs.
6. Monitor Data Refresh
Schedule automatic refresh to ensure updated insights.
7. Conduct Monthly Performance Reviews
Use the Month Analysis page during review meetings.
How Can This Dashboard Support Renewable Energy Growth?
Renewable energy requires strong financial control.
When organizations track performance clearly:
-
They attract more investors
-
They reduce waste
-
They improve ROI
-
They expand confidently
-
They enhance sustainability goals
Therefore, this dashboard supports long-term growth.
Conclusion
Renewable infrastructure projects demand precise monitoring. Without structured reporting, organizations lose visibility.
However, when you implement a Renewable Infrastructure Projects Dashboard in Power BI, you gain complete control.
You can:
-
Monitor ROI
-
Track investment
-
Analyze costs
-
Compare regions
-
Evaluate energy sources
-
Detect monthly trends
As a result, you make smarter investment decisions. You reduce risk. You improve profitability.
Therefore, if you manage renewable infrastructure projects, this dashboard becomes an essential performance management tool.
Frequently Asked Questions with Answers
1. What is a Renewable Infrastructure Projects Dashboard in Power BI?
It is an interactive Power BI report that tracks ROI, investment, costs, revenue, and project performance across renewable energy infrastructure projects.
2. Who should use this dashboard?
Project managers, finance teams, renewable energy investors, infrastructure consultants, and executive leadership teams can use it.
3. Can I track multiple energy sources in one dashboard?
Yes. You can track solar, wind, hydro, biomass, geothermal, and other renewable sources together.
4. Does this dashboard support regional comparison?
Yes. The Region Analysis page compares subsidies, investment, and ROI by region.
5. Can I analyze monthly performance trends?
Yes. The Month Analysis page shows time-based trends for investment, cost, revenue, and ROI.
6. Why is ROI tracking important in renewable infrastructure?
ROI helps you evaluate project profitability and allocate capital effectively.
7. Can I customize this dashboard?
Yes. You can modify visuals, add KPIs, and integrate additional data sources.
8. Does Power BI allow real-time data updates?
Yes. You can schedule automatic data refresh for real-time reporting.
Visit our YouTube channel to learn step-by-step video tutorials