Renewable infrastructure projects grow fast, and teams need accurate data to stay on track. Solar farms, wind energy parks, hydro projects, and other renewable installations operate with tight budgets, strict timelines, and important sustainability goals. Because these projects involve many departments and moving parts, managers must track performance indicators every day. A Renewable Infrastructure Projects KPI Dashboard in Power BI brings complete clarity to the entire process.
In this article, you will learn what this dashboard offers, how it works, and why every renewable project team should use it. You will also discover the advantages, best practices, and essential FAQs to help you make the most of it.
Click to Purchases Renewable Infrastructure Projects KPI Dashboard in Power BI
What Is a Renewable Infrastructure Projects KPI Dashboard in Power BI?
A Renewable Infrastructure Projects KPI Dashboard in Power BI is a ready-to-use data analytics tool designed for project teams, contractors, energy companies, and sustainability professionals. It tracks the most important KPIs related to renewable project development, installation, operation, efficiency, cost, and timelines. The dashboard collects data from Excel worksheets and converts it into easy visuals inside Power BI.
You can monitor actual numbers, compare performance with targets, and analyze trends for both MTD (Month-to-Date) and YTD (Year-to-Date). Because the dashboard uses slicers, drill-through pages, and structured KPI definitions, it becomes much easier to take decisions quickly.
Why Do Renewable Infrastructure Projects Need KPI Dashboards?
Renewable projects depend on consistent progress. A delay in procurement, a drop in efficiency, or a rise in operational costs can affect the entire project. With a KPI dashboard, teams can check performance in real time. It helps project managers:
-
Identify risks early
-
Compare actual progress with targets
-
Monitor timelines
-
Improve productivity
-
Reduce operational errors
-
Increase transparency
Since Power BI updates visuals instantly, users can review the performance of each KPI with one click. The dashboard also replaces manual reports, which saves time and avoids confusion across departments.
Key Features of the Renewable Infrastructure Projects KPI Dashboard in Power BI
This dashboard contains three powerful pages, each built to give clear insights. You can use the dashboard with real project data stored in an Excel file. Let’s explore each page in detail.
1. Summary Page – The Main Performance Overview
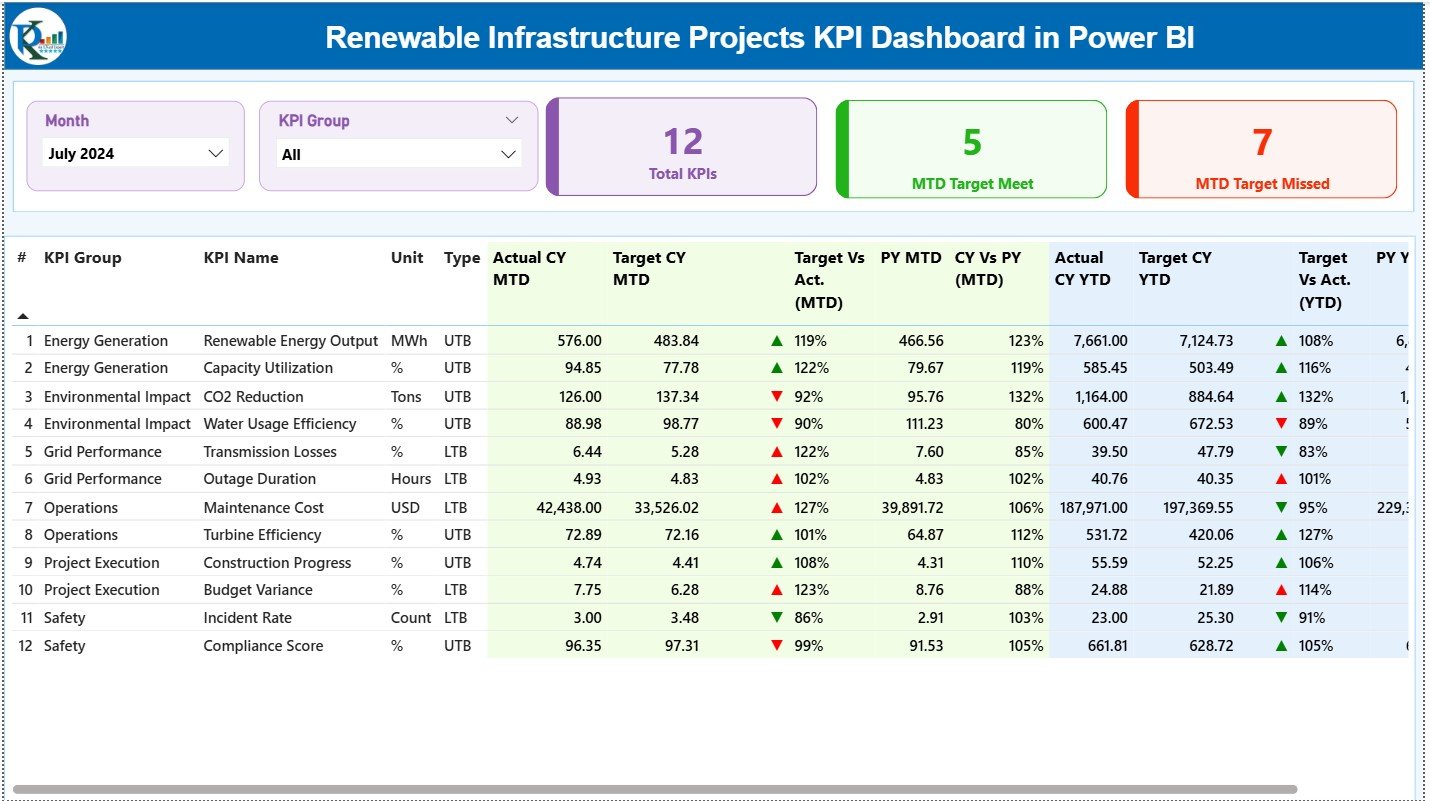
The Summary Page is the heart of the dashboard. It gives an instant view of all KPIs with filters for Month and KPI Group. You can track the status of performance at a glance.
Key Elements on the Summary Page
✔ Month and KPI Group Slicers
These filters allow users to choose a month and a KPI category. As soon as you select the month, the entire dashboard updates instantly.
✔ Three KPI Cards
These cards give a quick snapshot:
-
Total KPIs Count
-
MTD Target Meet Count
-
MTD Target Missed Count
These numbers help you understand overall project performance without checking each KPI manually.
✔ Detailed KPI Table
Below the cards, the dashboard shows a complete KPI table with the following information:
-
KPI Number – A unique identifier
-
KPI Group – Category of the KPI (Energy Efficiency, Cost, Safety, etc.)
-
KPI Name – The exact metric you want to track
-
Unit – Measurement unit (MW, %, hours, etc.)
-
Type – LTB (Lower the Better) or UTB (Upper the Better)
The table also highlights MTD and YTD performance in detail.
MTD (Month-to-Date) Metrics
-
Actual CY MTD – Current month’s actual value
-
Target CY MTD – Target value for the month
-
MTD Icon – Green ▲ or red ▼ indicator
-
Target vs Actual (MTD) – Calculated using:
Actual MTD / Target MTD -
PY MTD – Previous year’s MTD value
-
CY vs PY (MTD) – Comparison using:
Current MTD / Previous Year MTD
YTD (Year-to-Date) Metrics
-
Actual CY YTD
-
Target CY YTD
-
YTD Icon – ▲ or ▼ depending on performance
-
Target vs Actual (YTD) –
Actual YTD / Target YTD -
PY YTD – Previous year’s YTD
-
CY vs PY (YTD) –
Current YTD / Previous YTD
This structured table helps users check performance accuracy, identify improvement areas, and monitor long-term progress.
Click to Purchases Renewable Infrastructure Projects KPI Dashboard in Power BI
2. KPI Trend Page – Visual Trend Insights
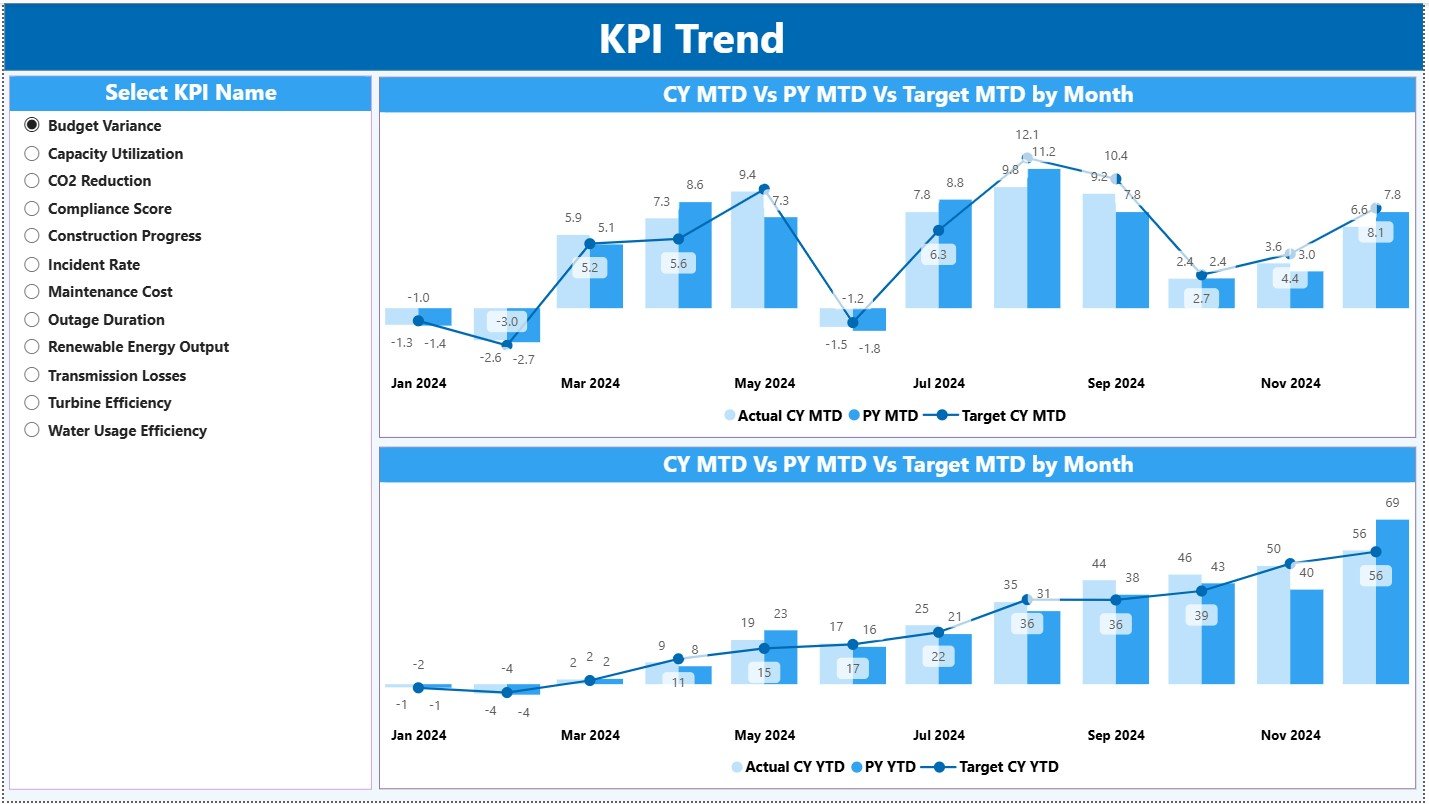
This page shows the trend of each KPI over time. You can choose the KPI from the slicer on the left, and the visuals update instantly.
Visuals on the Trend Page
✔ MTD Combo Chart – Compares:
-
Actual MTD
-
Previous Year MTD
-
Target MTD
✔ YTD Combo Chart – Shows:
-
Actual YTD
-
Previous Year YTD
-
Target YTD
These trend lines help project leaders identify:
-
Seasonal patterns
-
Growth in efficiency
-
Performance gaps
-
Improvement opportunities
Because charts are easy to read, the page supports faster decision-making during review meetings.
3. KPI Definition Page – Complete KPI Reference
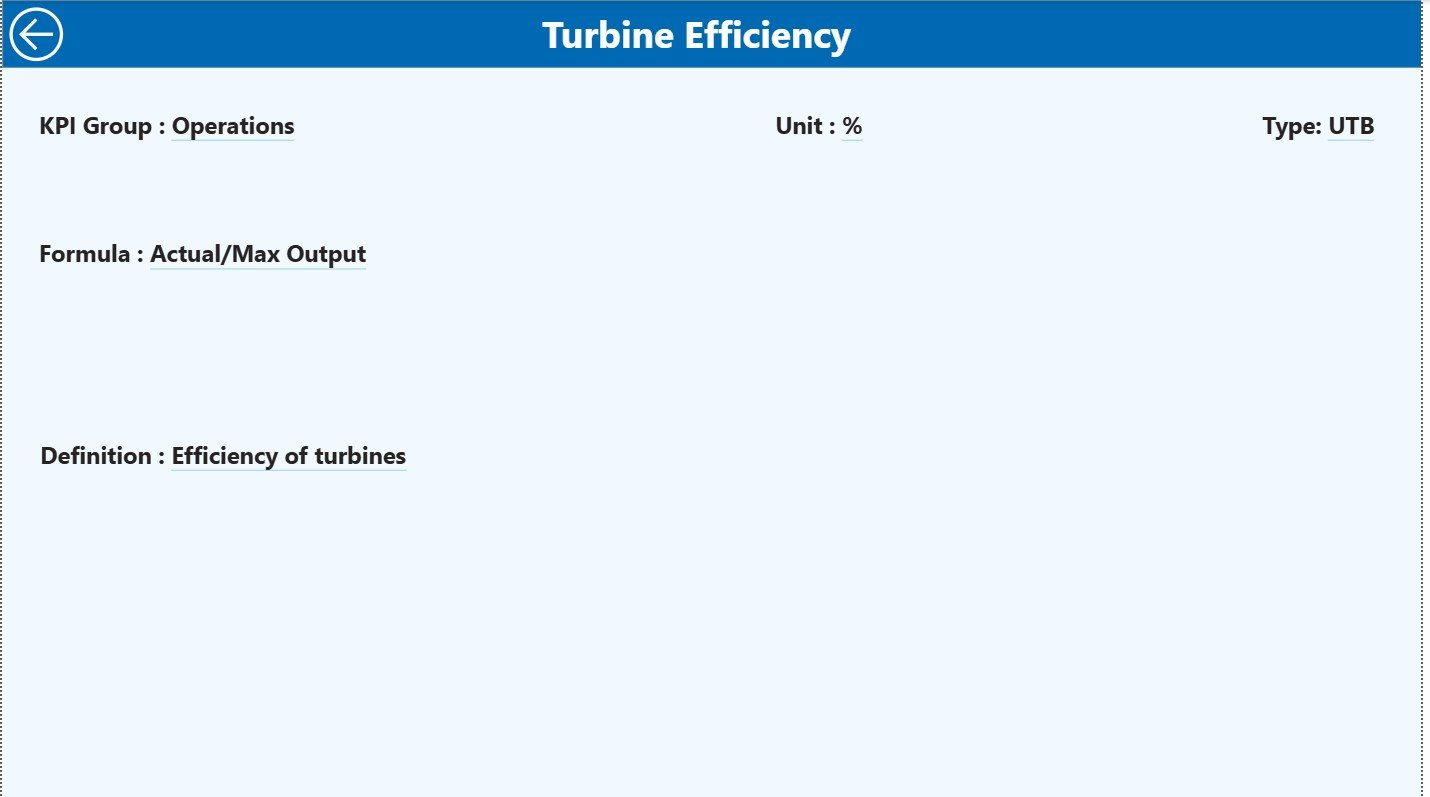
This is a hidden drill-through page. When you right-click a KPI on the summary table, you can drill through to view:
-
KPI Number
-
KPI Group
-
KPI Name
-
Unit
-
Formula
-
Definition
-
Type (LTB or UTB)
A back button on the top-left corner returns you to the main page.
This setup ensures clarity for all departments. New team members can understand KPIs instantly without confusion.
Excel Data Structure Used in This Dashboard
The dashboard uses an Excel file as the main data source. The Excel file contains three worksheets, and each sheet plays an important role.
1. Input_Actual Sheet – Actual Performance Entry
Users record:
-
KPI Name
-
Month (first date of month)
-
MTD Actual
-
YTD Actual
This sheet acts as the primary source of real performance numbers.
2. Input_Target Sheet – Monthly & Yearly Targets
Users record:
-
KPI Name
-
Month (first date of month)
-
MTD Target
-
YTD Target
These values help compare actual vs target.
3. KPI Definition Sheet – KPI Metadata
Users fill:
-
KPI Number
-
KPI Group
-
KPI Name
-
Unit
-
Formula
-
Definition
-
Type (LTB/UTB)
This sheet ensures a clear structure for each KPI.
Click to Purchases Renewable Infrastructure Projects KPI Dashboard in Power BI
Advantages of a Renewable Infrastructure Projects KPI Dashboard in Power BI
This dashboard helps project teams stay organized and aligned. Here are the major advantages:
1. Real-Time Performance Tracking
Managers can check actual numbers and compare them with targets instantly. Because data loads from Excel into Power BI, updates reflect immediately.
2. Improved Operational Efficiency
Users identify delays, inefficiencies, or cost overruns early. This helps teams fix issues quickly and maintain consistent project progress.
3. Clear Visualization of Trends
The KPI Trend page shows how performance shifts month after month. This helps forecast future performance and supports strategic planning.
4. Better Collaboration Among Teams
Everyone refers to the same dashboard. This avoids communication gaps and keeps engineering, planning, procurement, and management aligned.
5. Increased Transparency and Accountability
The dashboard highlights metrics with red and green icons. Teams understand which KPIs require attention, and this promotes ownership.
6. Faster Monthly Reporting
Manual report creation takes hours. Power BI reduces time as visuals refresh automatically. Managers can share the dashboard during review meetings without extra work.
Best Practices for Using the Renewable Infrastructure Projects KPI Dashboard in Power BI
To get the best results, follow these simple best practices:
1. Keep the Excel Data Clean
Enter consistent names, correct dates, and accurate numbers. Clean data always creates accurate visuals.
2. Update Actual Values Regularly
A dashboard only works when actual numbers remain updated. Make sure teams update MTD and YTD values monthly or weekly.
3. Define KPIs Clearly
Use clear KPI definitions. Make sure everyone understands what each KPI means and how it is calculated.
4. Use LTB and UTB Correctly
Some KPIs perform better when the value increases, while others perform better when the value decreases. Always assign the correct type.
5. Review Trends Monthly
The KPI Trend page shows patterns that help in long-term planning. Review this page every month for better forecasting.
6. Use Filters Wisely
Use slicers to focus on a project, KPI group, or specific month. This improves clarity and helps in root-cause analysis.
Conclusion
A Renewable Infrastructure Projects KPI Dashboard in Power BI helps project managers, engineers, analysts, and leadership teams track performance accurately. It brings all KPIs into one dashboard, supports quick decisions, and ensures data-driven planning. With structured Excel input sheets, drill-through features, visual charts, and clear KPI definitions, the dashboard becomes an essential tool for every renewable infrastructure project.
Whether you manage solar installations, wind energy farms, bioenergy projects, or large-scale infrastructure expansion, this dashboard improves visibility, enhances productivity, and supports long-term sustainability goals.
Click to Purchases Renewable Infrastructure Projects KPI Dashboard in Power BI
Frequently Asked Questions (FAQs)
1. What is the purpose of a KPI dashboard for renewable infrastructure projects?
The dashboard helps track performance, compare actual results with targets, and identify project risks early. It improves decision-making and ensures smooth project execution.
2. Can beginners use this Power BI dashboard?
Yes. The dashboard has simple visuals, slicers, and drill-through features. Even beginners can understand KPI performance quickly.
3. How often should I update the Excel data?
Update the MTD and YTD numbers at least once a month. Weekly updates give even more accurate insights.
4. Why do we use LTB and UTB types in KPIs?
Some KPIs perform better when the value goes up (UTB), while some perform better when the value goes down (LTB). Using the correct type helps users understand KPI status correctly.
5. Can I add more KPIs to this dashboard?
Yes. You can add more KPIs by updating the KPI Definition, Input_Actual, and Input_Target sheets. Power BI will automatically refresh the dashboard.
Click to Purchases Renewable Infrastructure Projects KPI Dashboard in Power BI
Visit our YouTube channel to learn step-by-step video tutorials