In today’s competitive manufacturing environment, specialty chemical companies must rely on accurate data to manage production efficiency, quality standards, safety compliance, and financial performance. However, many organizations still depend on scattered spreadsheets and manual reports. As a result, decision-makers often struggle to understand performance trends quickly.
Therefore, businesses increasingly adopt Power BI dashboards to transform raw data into actionable insights. One powerful solution designed specifically for this purpose is the Specialty Chemicals KPI Dashboard in Power BI.
This article explains everything you need to know about the Specialty Chemicals KPI Dashboard in Power BI, including its structure, features, benefits, implementation process, best practices, and frequently asked questions.
Click to Purchases Specialty Chemicals KPI Dashboard in Power BI
What Is a Specialty Chemicals KPI Dashboard in Power BI?
A Specialty Chemicals KPI Dashboard in Power BI is an interactive analytics solution that helps chemical manufacturers track key performance indicators (KPIs) through dynamic visuals and automated calculations.
Instead of reviewing multiple Excel files separately, managers can monitor all operational metrics from a centralized dashboard. Consequently, teams gain better visibility and make faster decisions.
This dashboard captures data using an Excel file and converts it into meaningful reports inside Power BI. Moreover, slicers and drill-through functionality allow users to analyze performance from different perspectives instantly.
Why Do Specialty Chemical Companies Need KPI Dashboards?
Specialty chemical manufacturing involves complex processes such as formulation control, batch production, safety monitoring, and quality testing. Therefore, tracking performance manually becomes difficult.
A KPI dashboard solves this challenge because it:
-
Consolidates operational data in one place
-
Tracks targets versus actual performance
-
Highlights performance gaps instantly
-
Improves accountability across departments
-
Supports data-driven decision making
As industries become more data-focused, dashboards no longer remain optional tools. Instead, they become essential management systems.
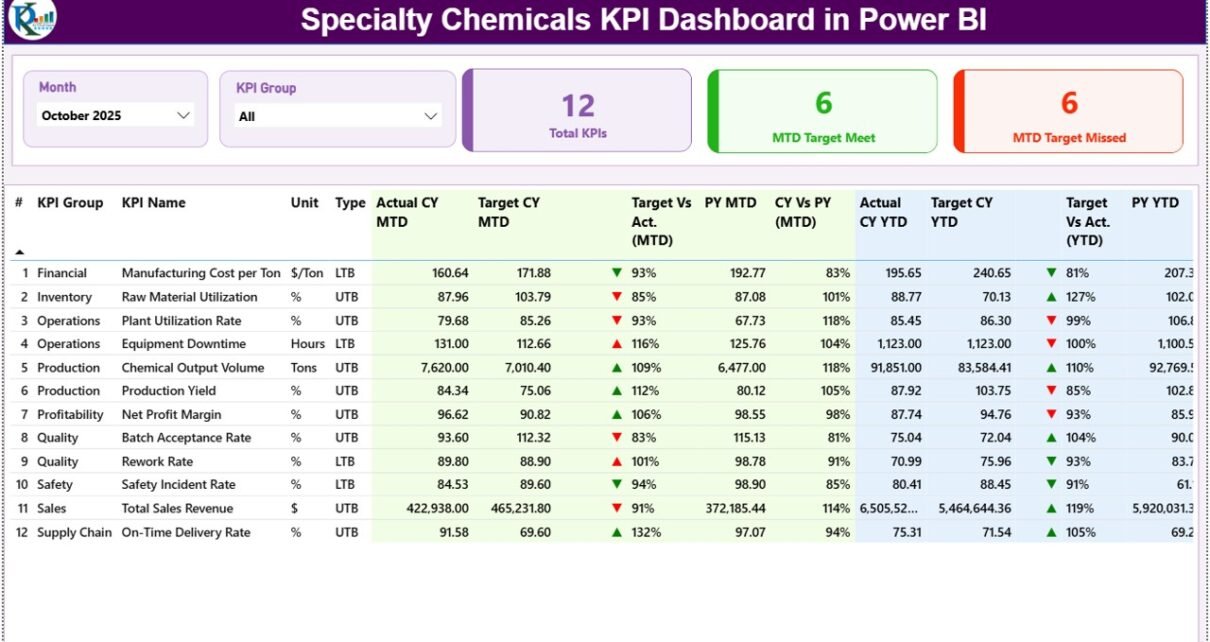
Key Features of the Specialty Chemicals KPI Dashboard in Power BI
The dashboard includes three powerful report pages designed to deliver complete performance visibility.
1. Summary Page – The Main Performance Overview
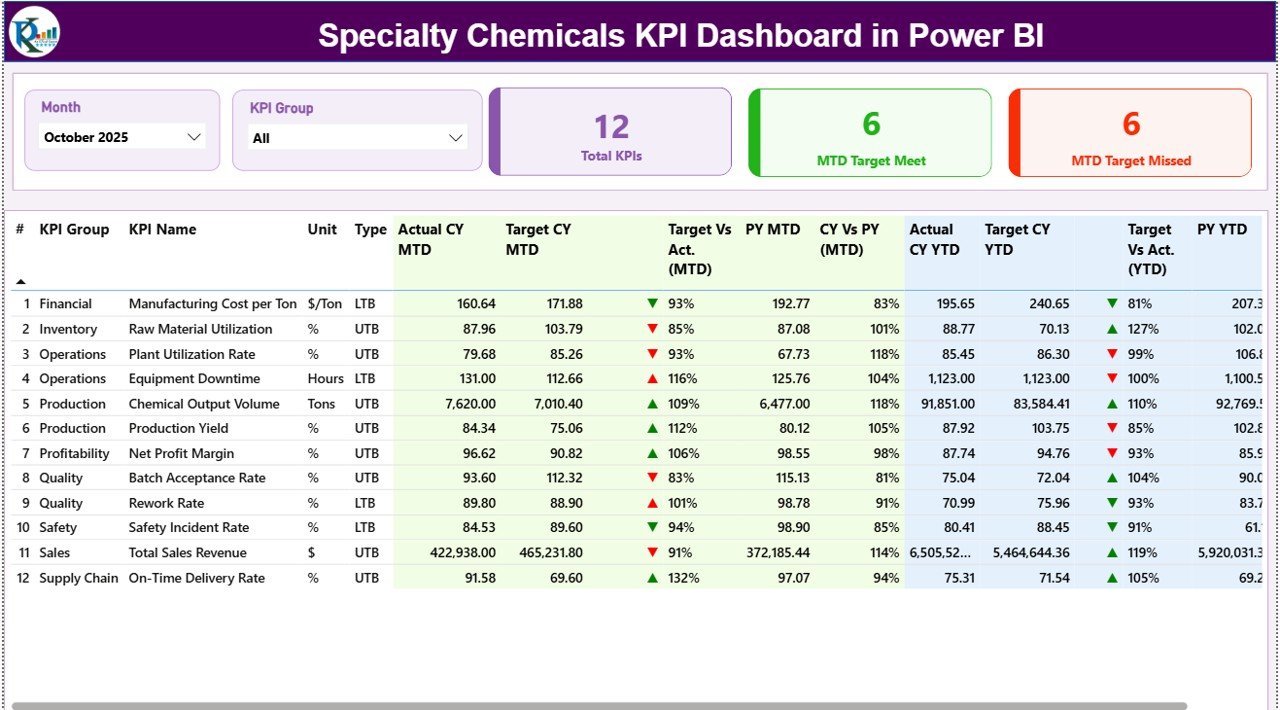
The Summary Page acts as the central control panel of the dashboard. Here, users can quickly evaluate KPI performance without navigating multiple reports.
Top-Level Filters (Slicers)
At the top section, users can select:
-
Month slicer – Changes all visuals dynamically
-
KPI Group slicer – Filters KPIs by category
Because of these slicers, users can analyze specific operational areas within seconds.
KPI Performance Cards
The dashboard displays three important KPI cards:
-
Total KPI Count – Shows total monitored KPIs
-
MTD Target Meet Count – KPIs achieving targets
-
MTD Target Missed Count – KPIs below expectations
These cards immediately communicate performance health.
Detailed KPI Performance Table
Below the cards, a detailed performance table provides deep insights.
KPI Identification Fields
-
KPI Number – Sequential identifier
-
KPI Group – KPI category or department
-
KPI Name – Performance indicator name
-
Unit – Measurement unit
-
Type – LTB (Lower the Better) or UTB (Upper the Better)
MTD (Month-To-Date) Performance Metrics
-
Actual CY MTD – Current year actual performance
-
Target CY MTD – Planned monthly target
-
MTD Icon – ▲ Green or ▼ Red indicators showing performance status
-
Target vs Actual (MTD) – Actual ÷ Target percentage
-
PY MTD – Previous year performance comparison
-
CY vs PY (MTD) – Growth comparison with last year
Because visual icons highlight results instantly, managers quickly identify problem areas.
Click to Purchases Specialty Chemicals KPI Dashboard in Power BI
YTD (Year-To-Date) Performance Metrics
-
Actual CY YTD – Current year cumulative performance
-
Target CY YTD – Annual target values
-
YTD Icon – Visual performance indicators
-
Target vs Actual (YTD) – Target achievement percentage
-
PY YTD – Previous year cumulative data
-
CY vs PY (YTD) – Year-over-year comparison
Therefore, organizations evaluate both short-term and long-term performance simultaneously.
2. KPI Trend Page – Performance Over Time
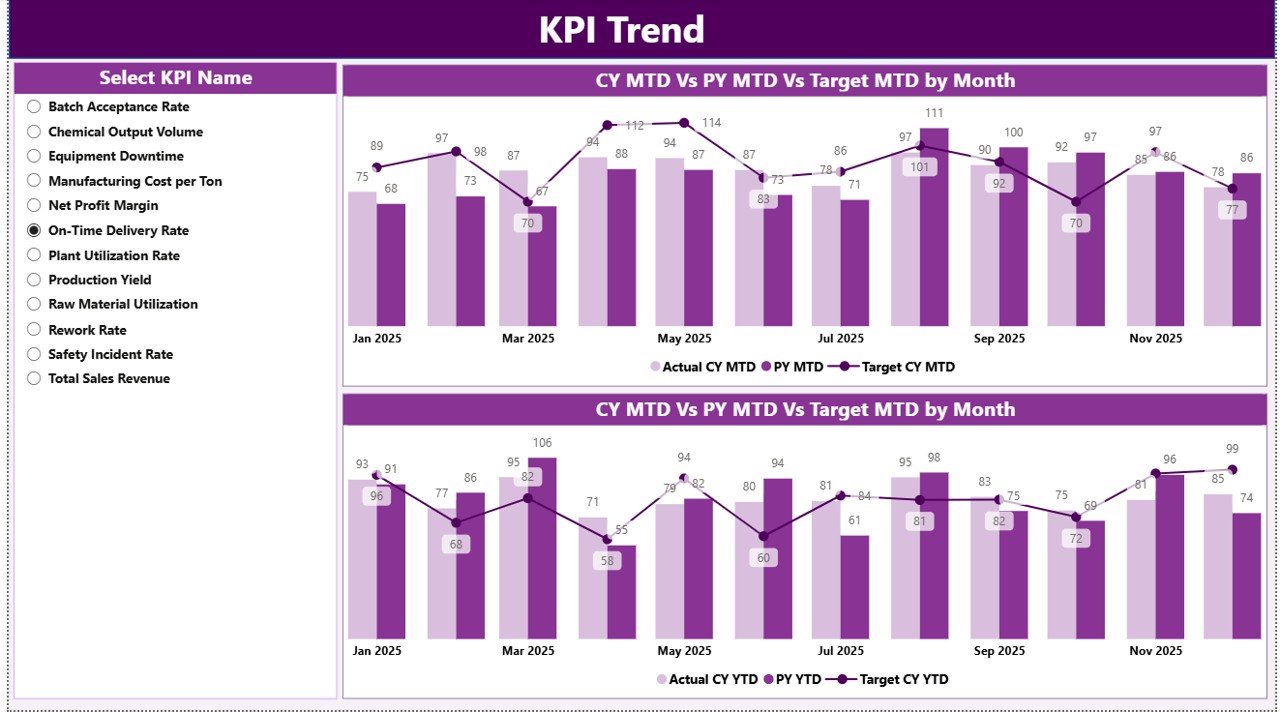
While the summary page shows status, the KPI Trend Page explains performance behavior.
Interactive KPI Selection
A slicer on the left allows users to select any KPI instantly.
Combo Charts Included
The page displays two combo charts:
-
MTD Performance Trend
-
YTD Performance Trend
Each chart compares:
-
Current Year Actual
-
Previous Year Actual
-
Target Values
As a result, users understand trends, seasonality, and growth patterns easily.
3. KPI Definition Page – Drill-Through Insights
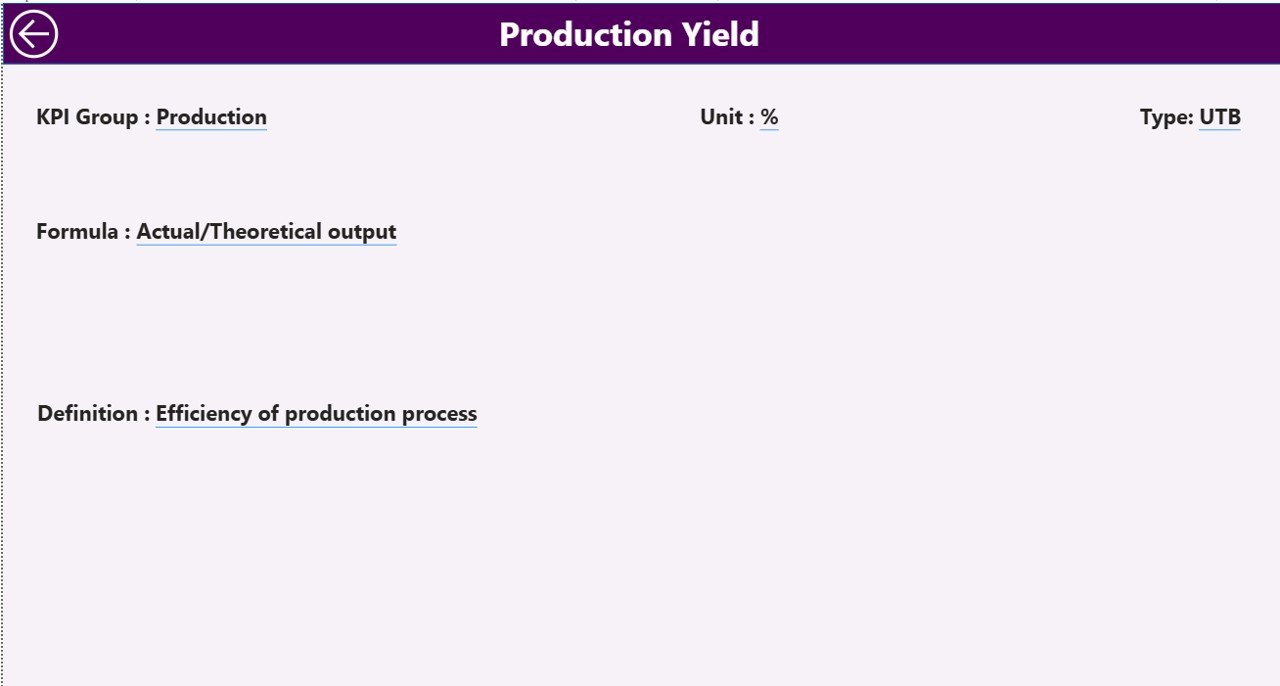
The KPI Definition Page provides detailed explanations of KPIs.
Click to Purchases Specialty Chemicals KPI Dashboard in Power BI
Key Details Available
-
KPI Formula
-
KPI Definition
-
Measurement logic
-
KPI Type classification
This page remains hidden and works through drill-through functionality.
Users simply right-click a KPI on the summary page to view detailed information. Then, they can return using the back button.
Excel Data Structure Behind the Dashboard
Power BI connects directly to an Excel data source. Therefore, users only need to update Excel sheets to refresh the dashboard automatically.
The Excel file contains three worksheets.
1. Input_Actual Sheet
Users enter actual performance data here.
Required fields include:
-
KPI Name
-
Month (first date of month)
-
MTD Value
-
YTD Value
Once updated, Power BI reflects changes instantly after refresh.
2. Input_Target Sheet
This sheet stores planned performance targets.
Users fill:
-
KPI Name
-
Month
-
MTD Target
-
YTD Target
Because targets exist separately, organizations compare plans with actual results accurately.
3. KPI Definition Sheet
This sheet acts as the KPI master database.
Columns include:
-
KPI Number
-
KPI Group
-
KPI Name
-
Unit
-
Formula
-
Definition
-
KPI Type (LTB/UTB)
This structured approach ensures data consistency.
How Does the Dashboard Improve Decision-Making?
The dashboard transforms raw numbers into insights.
For example:
-
Production managers identify efficiency gaps quickly.
-
Quality teams monitor defect reduction performance.
-
Finance teams evaluate productivity impact.
-
Leadership tracks overall operational health.
Consequently, decisions become faster and more accurate.
Advantages of Specialty Chemicals KPI Dashboard in Power BI
Why Should Organizations Use This Dashboard?
✅ Centralized Performance Monitoring
All KPIs appear in one location. Therefore, teams avoid switching between reports.
✅ Real-Time Insights
Data refresh updates visuals automatically. As a result, managers always view current performance.
✅ Easy Target Tracking
Visual indicators instantly show whether KPIs meet targets.
✅ Historical Comparison
Year-over-year analysis highlights growth trends.
✅ Improved Accountability
Departments clearly understand performance expectations.
✅ Interactive Analysis
Users filter KPIs by month or category effortlessly.
✅ Reduced Manual Reporting
Automation eliminates repetitive reporting tasks.
How to Implement the Specialty Chemicals KPI Dashboard?
Click to Purchases Specialty Chemicals KPI Dashboard in Power BI
Step 1: Define KPIs Clearly
First, identify operational, financial, and quality KPIs relevant to your plant.
Step 2: Prepare Excel Data
Next, structure data using the three input sheets.
Step 3: Load Data into Power BI
Import Excel data into Power BI Desktop.
Step 4: Configure Relationships
Ensure KPI definitions connect correctly with actual and target tables.
Step 5: Publish Dashboard
After validation, publish reports to Power BI Service.
Step 6: Schedule Refresh
Enable automatic refresh for continuous monitoring.
Which KPIs Are Common in Specialty Chemical Manufacturing?
Typical KPIs include:
-
Production Yield
-
Batch Success Rate
-
Energy Consumption
-
Downtime Percentage
-
Quality Defect Rate
-
On-Time Delivery Rate
-
Inventory Turnover
-
Safety Incident Rate
-
Cost per Batch
-
Customer Complaint Rate
Tracking these metrics ensures operational excellence.
Best Practices for the Specialty Chemicals KPI Dashboard in Power BI
How Can You Get Maximum Value?
✔ Maintain Clean Data
Always validate Excel inputs before refreshing data.
✔ Use Standard KPI Definitions
Keep formulas consistent across departments.
✔ Update Data Regularly
Frequent updates improve decision accuracy.
✔ Monitor Both MTD and YTD
Short-term and long-term analysis creates balanced insights.
✔ Train End Users
Ensure managers understand slicers and drill-through features.
✔ Limit Overloaded Visuals
Focus only on meaningful KPIs.
✔ Review KPIs Periodically
Business priorities change; therefore, dashboards should evolve.
Common Challenges and How to Solve Them
1. Data Inconsistency
Use standardized templates for data entry.
2. KPI Misinterpretation
Provide clear KPI definitions through drill-through pages.
3. Low User Adoption
Offer short training sessions.
4. Manual Data Errors
Implement validation rules in Excel sheets.
Future Scope of KPI Dashboards in Chemical Industry
The future of analytics continues to evolve rapidly.
Soon, organizations will integrate:
-
Predictive analytics
-
AI-driven anomaly detection
-
Automated alerts
-
IoT production data integration
Therefore, dashboards will shift from reporting tools to intelligent decision systems.
Conclusion
The Specialty Chemicals KPI Dashboard in Power BI provides a powerful, structured, and user-friendly solution for monitoring operational performance. Instead of relying on manual analysis, organizations gain instant visibility into KPI achievements, trends, and gaps.
Because the dashboard combines Excel flexibility with Power BI visualization capabilities, companies achieve both simplicity and analytical power.
As competition increases in the specialty chemicals industry, businesses that adopt data-driven dashboards will make faster decisions, improve efficiency, and achieve sustainable growth.
Frequently Asked Questions (FAQs)
Click to Purchases Specialty Chemicals KPI Dashboard in Power BI
1. What is the main purpose of the Specialty Chemicals KPI Dashboard?
The dashboard helps organizations monitor KPI performance, compare targets with actual results, and analyze trends using interactive visuals.
2. Do I need advanced Power BI skills to use this dashboard?
No. Users only update Excel sheets, and Power BI automatically updates visuals after refresh.
3. Can I customize KPIs in the dashboard?
Yes. You can add or modify KPIs through the KPI Definition sheet.
4. What does LTB and UTB mean?
-
LTB (Lower the Better): Lower values indicate better performance.
-
UTB (Upper the Better): Higher values indicate better performance.
5. How often should data be updated?
Organizations typically update data monthly; however, you can refresh it more frequently if needed.
6. Can this dashboard work for other manufacturing industries?
Yes. You can easily adapt it for pharmaceuticals, food processing, or industrial manufacturing.
7. Why compare Current Year with Previous Year?
Year-over-year comparison helps identify growth trends and operational improvements.
8. Is Excel required for this dashboard?
Yes. Excel serves as the data input source for actual, target, and KPI definition data.
Visit our YouTube channel to learn step-by-step video tutorials