Home>Blogs>Charts and Visualization>Spotlight Visualization in Excel (Part-1)>Spotlight Visualization
Spotlight Visualization
18
Jun 2019
226Comments Off on Spotlight Visualization
PK
Meet PK, the founder of PK-AnExcelExpert.com! With over 15 years of experience in Data Visualization, Excel Automation, and dashboard creation. PK is a Microsoft Certified Professional who has a passion for all things in Excel. PK loves to explore new and innovative ways to use Excel and is always eager to share his knowledge with others. With an eye for detail and a commitment to excellence, PK has become a go-to expert in the world of Excel. Whether you're looking to create stunning visualizations or streamline your workflow with automation, PK has the skills and expertise to help you succeed. Join the many satisfied clients who have benefited from PK's services and see how he can take your Excel skills to the next level!
https://www.pk-anexcelexpert.com
Related Articles
Credit Rating Agencies Dashboard in Excel
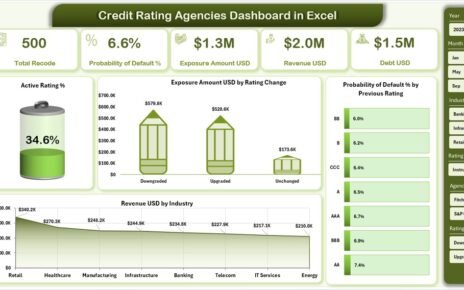
Managing credit risk requires clarity, accuracy, and timely insights. However, many finance teams still depend on scattered spreadsheets, static reports,
Home Inspection Dashboard in Excel
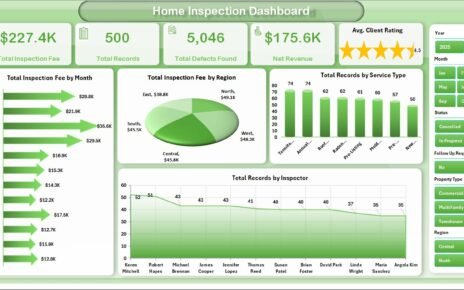
The Home Inspection Dashboard in Excel tracks 5 core KPIs across 5 interactive analysis pages with 16 pre-built pivot-driven charts
Debt Management KPI Scorecard in Excel
Managing debt effectively has become extremely important for organizations, financial institutions, and even individuals. Businesses often rely on loans, credit


