Virtual events have become a core part of modern marketing, training, and community engagement strategies. Webinars, virtual conferences, online workshops,
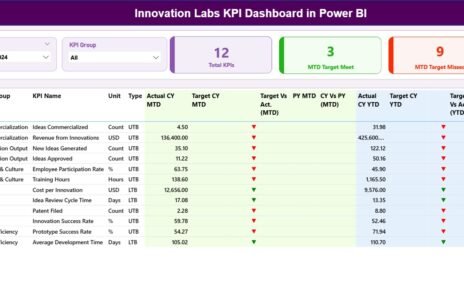
Innovation labs play a critical role in shaping the future of organizations. They experiment, test ideas, build prototypes, and convert
Reconciliation is a critical process for businesses, ensuring that their financial records match the bank’s statements. A Bank Account Reconciliation