The video game industry continues to grow at an extraordinary pace. Game studios now manage complex development pipelines, large creative teams, multiple platforms, tight deadlines, and rising player expectations. However, many studios still track progress using disconnected Excel files, manual status updates, and scattered reports. As a result, teams lose visibility, delays increase, and budgets go out of control.
That is exactly where a Video Game Development Dashboard in Power BI becomes a powerful solution.
This dashboard converts raw development data into interactive, visual, and actionable insights. It allows game producers, project managers, leads, and studio heads to track tasks, effort, overruns, and priorities in one centralized place. Moreover, it helps teams make faster decisions and deliver games on time and within budget.
Click to Purchases Video Game Development Dashboard in Power BI
In this detailed article, you will learn what a Video Game Development Dashboard in Power BI is, why it matters, how it works, its dashboard pages, key features, advantages, best practices, and frequently asked questions. By the end, you will clearly understand how this dashboard improves productivity and control in game development projects.
What Is a Video Game Development Dashboard in Power BI?
A Video Game Development Dashboard in Power BI is an interactive analytics and reporting tool designed to monitor, analyze, and visualize game development performance metrics.
Instead of reviewing static spreadsheets or manual reports, teams use this dashboard to:
-
Track task completion and progress
-
Compare planned effort versus actual effort
-
Identify overruns early
-
Analyze performance by platform, phase, task type, and month
-
Improve collaboration and accountability
Because Power BI updates visuals dynamically, stakeholders can instantly see the latest project status. As a result, teams react faster to risks and bottlenecks.
Why Do Game Studios Need a Video Game Development Dashboard?
Game development involves multiple moving parts. Art, design, programming, testing, audio, and production teams work together under tight timelines. However, without structured analytics, managing these teams becomes extremely challenging.
A Video Game Development Dashboard in Power BI solves these problems effectively.
Common Challenges Without a Dashboard
-
Teams rely on manual progress tracking
-
Managers lack real-time visibility
-
Effort overruns remain unnoticed
-
Task priorities become unclear
-
Decision-making slows down
How the Dashboard Helps
-
Centralizes all development data
-
Highlights delays and overruns early
-
Improves transparency across teams
-
Supports data-driven planning
-
Enhances delivery predictability
Therefore, studios gain better control over quality, time, and cost.
How Does a Video Game Development Dashboard in Power BI Work?
The dashboard works by connecting structured development data to Power BI visuals. Teams capture data such as tasks, effort hours, platforms, phases, priorities, and timelines in a data source like Excel or a database.
Power BI then transforms this data into:
-
KPI cards
-
Interactive charts
-
Slicers (filters)
-
Comparative visuals
Because slicers control the entire dashboard, users can analyze data dynamically by platform, phase, task type, or month.
Key Features of the Video Game Development Dashboard in Power BI
This ready-to-use dashboard contains five analytical pages, each focusing on a specific aspect of game development performance.
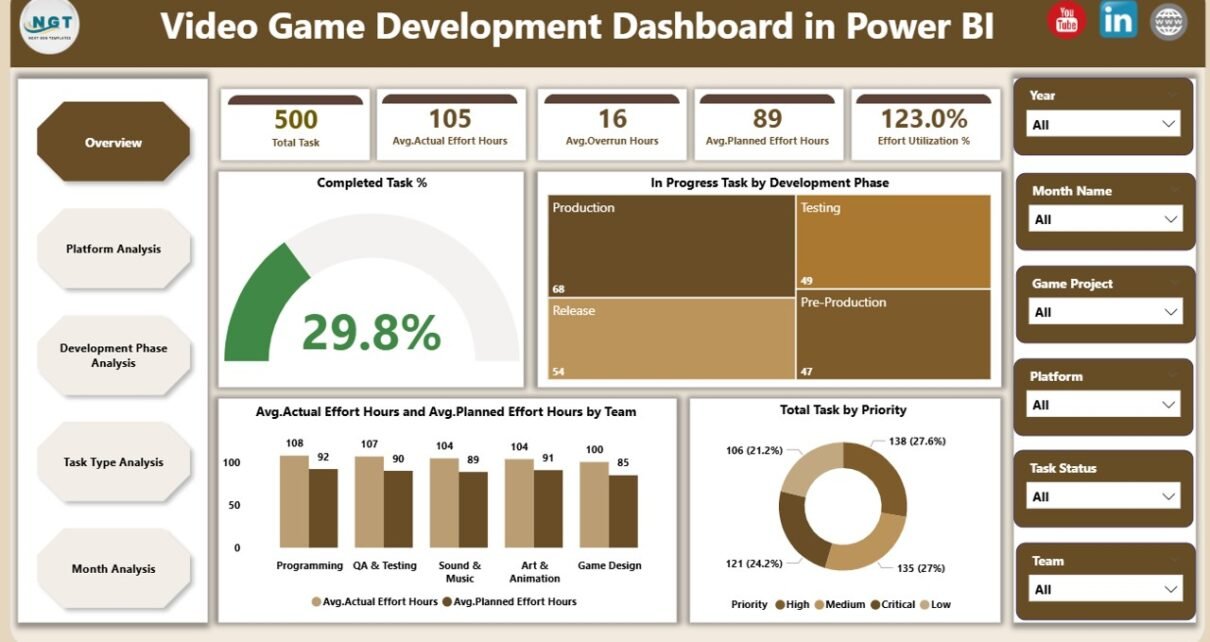
What Is Covered in the Overview Page?

The Overview Page acts as the central control panel of the dashboard. It provides a high-level snapshot of the entire development project.
Key Elements of the Overview Page
-
Interactive slicers for quick filtering
-
KPI cards showing overall performance
-
Summary charts for instant insights
KPIs and Visuals on the Overview Page
-
Completed Task % – Shows how much work is finished
-
In Progress Task by Development Phases – Displays ongoing tasks across phases
-
Average Actual Effort Hours – Highlights real effort spent
-
Average Planned Effort Hours by Team – Compares estimated effort
-
Total Task by Priority – Shows workload distribution
Because this page offers a bird’s-eye view, managers can instantly understand project health.
Click to Purchases Video Game Development Dashboard in Power BI
How Does Platform Analysis Improve Game Development Decisions?

Modern games release on multiple platforms such as PC, console, and mobile. Each platform demands different effort levels and skills. Therefore, analyzing performance by platform becomes essential.
Platform Analysis Page Overview
The Platform Analysis Page focuses on platform-specific insights and helps teams allocate resources effectively.
Charts Included in Platform Analysis
-
Avg. Actual vs Avg. Planned Effort Hours by Platform
-
In Progress Task by Platform
-
Total Task by Platform
Why Platform Analysis Matters
-
Identifies platforms causing overruns
-
Highlights uneven workload distribution
-
Supports platform-specific planning
-
Improves cost control
As a result, studios can balance effort across platforms and avoid last-minute surprises.
Why Is Development Phase Analysis Critical for Game Projects?

Game development follows structured phases such as concept, design, development, testing, and release. Each phase contributes differently to timelines and costs.
Development Phase Analysis Page Overview
The Development Phase Analysis Page allows teams to evaluate performance at every stage of the development lifecycle.
Charts Included in Development Phase Analysis
-
Avg. Actual vs Avg. Planned Effort Hours by Development Phase
-
Avg. Overrun Hours by Development Phase
-
Total Task by Development Phase
Benefits of Phase-Level Analysis
-
Detects problematic phases early
-
Improves sprint planning
-
Enhances cross-team coordination
-
Reduces risk of schedule slippage
Therefore, teams gain better control over project flow.
How Does Task Type Analysis Improve Productivity?

Different task types such as coding, design, testing, bug fixing, and documentation require different effort patterns. Without analysis, teams cannot optimize productivity.
Task Type Analysis Page Overview
The Task Type Analysis Page breaks down performance by task category.
Charts Included in Task Type Analysis
-
Avg. Actual vs Avg. Planned Effort Hours by Task Type
-
Avg. Overrun Hours by Task Type
-
Total Task by Task Type
Why Task Type Analysis Is Important
-
Identifies inefficient task categories
-
Improves workload planning
-
Supports skill-based allocation
-
Enhances estimation accuracy
As a result, studios reduce wasted effort and improve output quality.
Click to Purchases Video Game Development Dashboard in Power BI
What Insights Does Month Analysis Provide?

Game development performance changes over time due to deadlines, releases, and production cycles. Therefore, time-based analysis becomes crucial.
Month Analysis Page Overview
The Month Analysis Page tracks trends across months and reveals seasonal patterns.
Charts Included in Month Analysis
-
Avg. Actual vs Avg. Planned Effort Hours by Month
-
Avg. Overrun Hours by Month
-
Total Task by Month
Value of Monthly Analysis
-
Tracks productivity trends
-
Highlights peak workload periods
-
Supports long-term planning
-
Improves forecasting accuracy
Consequently, management gains historical and predictive insights.
Advantages of Video Game Development Dashboard in Power BI
Using a Video Game Development Dashboard in Power BI delivers significant benefits for studios of all sizes.
Key Advantages
-
✅ Centralized project visibility
-
✅ Real-time performance tracking
-
✅ Faster and smarter decision-making
-
✅ Early detection of delays and overruns
-
✅ Improved collaboration across teams
-
✅ Better effort estimation and planning
-
✅ Scalable for multiple projects
Because Power BI integrates easily with Excel and databases, teams implement it without complex IT support.
Who Should Use This Dashboard?
This dashboard supports multiple roles within a game studio.
Ideal Users
-
Game Producers
-
Project Managers
-
Development Leads
-
Studio Heads
-
Operations Managers
-
Finance Teams
Each user can analyze data based on their responsibility and goals.
Best Practices for the Video Game Development Dashboard in Power BI
To maximize the value of this dashboard, teams should follow proven best practices.
1. Maintain Clean and Structured Data
Always standardize task names, platforms, phases, and task types. Clean data ensures accurate insights.
2. Update Data Regularly
Schedule weekly or daily updates to keep dashboards relevant and actionable.
3. Use Slicers Effectively
Encourage teams to filter by platform, phase, or month to uncover deeper insights.
4. Review Overruns Proactively
Focus on overrun charts during reviews to address issues early.
5. Align KPIs With Studio Goals
Track metrics that directly impact delivery, quality, and cost.
6. Train Teams on Dashboard Usage
Educate stakeholders on how to interpret visuals correctly.
By following these practices, studios unlock the full power of analytics.
How Does Power BI Improve Game Development Reporting Compared to Excel?
Although Excel remains useful, Power BI delivers advanced capabilities.
Power BI vs Excel
-
Interactive dashboards instead of static sheets
-
Centralized reporting instead of multiple files
-
Faster insights with slicers and visuals
-
Better scalability for large datasets
Therefore, Power BI becomes the preferred analytics tool for modern studios.
Final Thoughts: Why You Should Use a Video Game Development Dashboard in Power BI
A Video Game Development Dashboard in Power BI transforms how studios manage projects. It replaces guesswork with clarity, delays with proactive planning, and confusion with control.
By using this dashboard, teams improve efficiency, reduce overruns, and deliver better games faster. Moreover, leadership gains confidence through data-driven decisions.
If your studio wants visibility, control, and performance improvement, this dashboard becomes an essential tool.
Frequently Asked Questions (FAQs)
What is a Video Game Development Dashboard in Power BI used for?
It tracks tasks, effort, overruns, and productivity across platforms, phases, task types, and months.
Can small game studios use this dashboard?
Yes, small and mid-sized studios benefit greatly because it improves planning and control without heavy investment.
Does this dashboard require advanced Power BI skills?
No, it uses standard Power BI visuals and slicers, making it easy to use.
Can I customize the dashboard?
Yes, teams can add KPIs, visuals, or filters based on project needs.
How often should data be updated?
Weekly updates work well, although daily updates provide even better insights.
Does the dashboard support multiple projects?
Yes, you can scale it to track multiple games using project filters.
Visit our YouTube channel to learn step-by-step video tutorials